Tamaricihabitans halophyticus
Taxonomy: cellular organisms; Bacteria; Terrabacteria group; Actinobacteria; Actinomycetia; Pseudonocardiales; Pseudonocardiaceae; Tamaricihabitans
Average proteome isoelectric point is 6.1
Get precalculated fractions of proteins

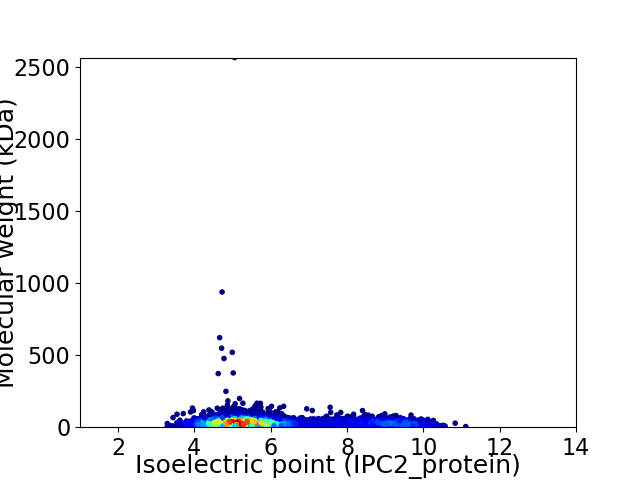
Virtual 2D-PAGE plot for 5978 proteins (isoelectric point calculated using IPC2_protein)
Get csv file with sequences according to given criteria:
* You can choose from 21 different methods for calculating isoelectric point
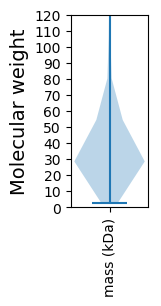
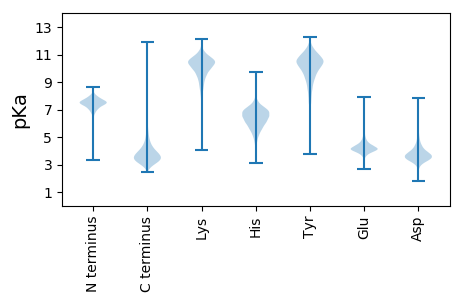
Summary statistics related to proteome-wise predictions


Protein with the lowest isoelectric point:
>tr|A0A4R2RAZ5|A0A4R2RAZ5_9PSEU Uncharacterized protein DUF4177 OS=Tamaricihabitans halophyticus OX=1262583 GN=EV191_101829 PE=4 SV=1
MM1 pKa = 7.95RR2 pKa = 11.84ARR4 pKa = 11.84SLVVGLLAGAGLVLASVMGPAAAAAPAAEE33 pKa = 4.27NPNDD37 pKa = 3.63GVTPYY42 pKa = 10.48IIGGEE47 pKa = 4.25DD48 pKa = 3.47ADD50 pKa = 3.76QEE52 pKa = 4.86YY53 pKa = 9.57PFMTSLQDD61 pKa = 3.72SQGHH65 pKa = 5.14FCGGSLISSEE75 pKa = 4.18WVLTAAHH82 pKa = 6.75CVQGSAPGDD91 pKa = 3.35FTARR95 pKa = 11.84IGSNDD100 pKa = 3.08NSQGGEE106 pKa = 3.84EE107 pKa = 4.17AGVTEE112 pKa = 4.78VVPHH116 pKa = 7.09PDD118 pKa = 3.04YY119 pKa = 11.61DD120 pKa = 4.06GASPGADD127 pKa = 2.57IALVKK132 pKa = 10.24LDD134 pKa = 4.43KK135 pKa = 10.77AVQAAPIKK143 pKa = 9.48VTGSTEE149 pKa = 3.63AGTASRR155 pKa = 11.84LLGWGQTCPEE165 pKa = 4.29QGCGDD170 pKa = 4.38VPTMLQQLDD179 pKa = 3.97TSVVAAEE186 pKa = 4.24EE187 pKa = 4.4CTGGIDD193 pKa = 5.33GSTEE197 pKa = 3.97LCTDD201 pKa = 3.64NPNGDD206 pKa = 3.37SGACYY211 pKa = 10.05GDD213 pKa = 3.2SGGPQIVQSGDD224 pKa = 2.26GWTQIGVTSRR234 pKa = 11.84TGNNDD239 pKa = 3.03PTCATGPSIYY249 pKa = 9.69TNAVAYY255 pKa = 8.63TDD257 pKa = 4.6WINEE261 pKa = 4.21TTGGALAAA269 pKa = 4.86
MM1 pKa = 7.95RR2 pKa = 11.84ARR4 pKa = 11.84SLVVGLLAGAGLVLASVMGPAAAAAPAAEE33 pKa = 4.27NPNDD37 pKa = 3.63GVTPYY42 pKa = 10.48IIGGEE47 pKa = 4.25DD48 pKa = 3.47ADD50 pKa = 3.76QEE52 pKa = 4.86YY53 pKa = 9.57PFMTSLQDD61 pKa = 3.72SQGHH65 pKa = 5.14FCGGSLISSEE75 pKa = 4.18WVLTAAHH82 pKa = 6.75CVQGSAPGDD91 pKa = 3.35FTARR95 pKa = 11.84IGSNDD100 pKa = 3.08NSQGGEE106 pKa = 3.84EE107 pKa = 4.17AGVTEE112 pKa = 4.78VVPHH116 pKa = 7.09PDD118 pKa = 3.04YY119 pKa = 11.61DD120 pKa = 4.06GASPGADD127 pKa = 2.57IALVKK132 pKa = 10.24LDD134 pKa = 4.43KK135 pKa = 10.77AVQAAPIKK143 pKa = 9.48VTGSTEE149 pKa = 3.63AGTASRR155 pKa = 11.84LLGWGQTCPEE165 pKa = 4.29QGCGDD170 pKa = 4.38VPTMLQQLDD179 pKa = 3.97TSVVAAEE186 pKa = 4.24EE187 pKa = 4.4CTGGIDD193 pKa = 5.33GSTEE197 pKa = 3.97LCTDD201 pKa = 3.64NPNGDD206 pKa = 3.37SGACYY211 pKa = 10.05GDD213 pKa = 3.2SGGPQIVQSGDD224 pKa = 2.26GWTQIGVTSRR234 pKa = 11.84TGNNDD239 pKa = 3.03PTCATGPSIYY249 pKa = 9.69TNAVAYY255 pKa = 8.63TDD257 pKa = 4.6WINEE261 pKa = 4.21TTGGALAAA269 pKa = 4.86
Molecular weight: 26.98 kDa
Isoelectric point according different methods:
Protein with the highest isoelectric point:
>tr|A0A4R2QZ34|A0A4R2QZ34_9PSEU Sugar/nucleoside kinase (Ribokinase family) OS=Tamaricihabitans halophyticus OX=1262583 GN=EV191_102157 PE=4 SV=1
MM1 pKa = 7.66KK2 pKa = 10.1VRR4 pKa = 11.84KK5 pKa = 9.11SLRR8 pKa = 11.84SLKK11 pKa = 9.97NRR13 pKa = 11.84PGSQVVRR20 pKa = 11.84RR21 pKa = 11.84HH22 pKa = 5.11GKK24 pKa = 9.21VLVINKK30 pKa = 9.15RR31 pKa = 11.84NPRR34 pKa = 11.84FKK36 pKa = 10.78ARR38 pKa = 11.84QGG40 pKa = 3.28
MM1 pKa = 7.66KK2 pKa = 10.1VRR4 pKa = 11.84KK5 pKa = 9.11SLRR8 pKa = 11.84SLKK11 pKa = 9.97NRR13 pKa = 11.84PGSQVVRR20 pKa = 11.84RR21 pKa = 11.84HH22 pKa = 5.11GKK24 pKa = 9.21VLVINKK30 pKa = 9.15RR31 pKa = 11.84NPRR34 pKa = 11.84FKK36 pKa = 10.78ARR38 pKa = 11.84QGG40 pKa = 3.28
Molecular weight: 4.7 kDa
Isoelectric point according different methods:
Peptides (in silico digests for buttom-up proteomics)
Below you can find in silico digests of the whole proteome with Trypsin, Chymotrypsin, Trypsin+LysC, LysN, ArgC proteases suitable for different mass spec machines.| Try ESI |
 |
|---|
| ChTry ESI |
 |
|---|
| ArgC ESI |
 |
|---|
| LysN ESI |
 |
|---|
| TryLysC ESI |
 |
|---|
| Try MALDI |
 |
|---|
| ChTry MALDI |
 |
|---|
| ArgC MALDI |
 |
|---|
| LysN MALDI |
 |
|---|
| TryLysC MALDI |
 |
|---|
| Try LTQ |
 |
|---|
| ChTry LTQ |
 |
|---|
| ArgC LTQ |
 |
|---|
| LysN LTQ |
 |
|---|
| TryLysC LTQ |
 |
|---|
| Try MSlow |
 |
|---|
| ChTry MSlow |
 |
|---|
| ArgC MSlow |
 |
|---|
| LysN MSlow |
 |
|---|
| TryLysC MSlow |
 |
|---|
| Try MShigh |
 |
|---|
| ChTry MShigh |
 |
|---|
| ArgC MShigh |
 |
|---|
| LysN MShigh |
 |
|---|
| TryLysC MShigh |
 |
|---|
General Statistics
Number of major isoforms |
Number of additional isoforms |
Number of all proteins |
Number of amino acids |
Min. Seq. Length |
Max. Seq. Length |
Avg. Seq. Length |
Avg. Mol. Weight |
|---|---|---|---|---|---|---|---|
0 |
1946036 |
26 |
23820 |
325.5 |
34.95 |
Amino acid frequency
Ala |
Cys |
Asp |
Glu |
Phe |
Gly |
His |
Ile |
Lys |
Leu |
|---|---|---|---|---|---|---|---|---|---|
13.272 ± 0.044 | 0.797 ± 0.013 |
5.832 ± 0.029 | 6.039 ± 0.031 |
2.851 ± 0.021 | 9.09 ± 0.031 |
2.131 ± 0.015 | 3.812 ± 0.026 |
1.889 ± 0.019 | 10.629 ± 0.043 |
Met |
Asn |
Gln |
Pro |
Arg |
Ser |
Thr |
Val |
Trp |
Tyr |
|---|---|---|---|---|---|---|---|---|---|
1.828 ± 0.016 | 2.034 ± 0.014 |
5.623 ± 0.028 | 3.16 ± 0.02 |
7.742 ± 0.03 | 5.326 ± 0.023 |
5.898 ± 0.021 | 8.491 ± 0.032 |
1.487 ± 0.012 | 2.069 ± 0.015 |
Most of the basic statistics you can see at this page can be downloaded from this CSV file
Proteome-pI is available under Creative Commons Attribution-NoDerivs license, for more details see here
| Reference: Kozlowski LP. Proteome-pI 2.0: Proteome Isoelectric Point Database Update. Nucleic Acids Res. 2021, doi: 10.1093/nar/gkab944 | Contact: Lukasz P. Kozlowski |
