Rhodovulum sulfidophilum (Rhodobacter sulfidophilus)
Taxonomy: cellular organisms; Bacteria; Proteobacteria; Alphaproteobacteria; Rhodobacterales; Rhodobacteraceae; Rhodovulum
Average proteome isoelectric point is 6.52
Get precalculated fractions of proteins

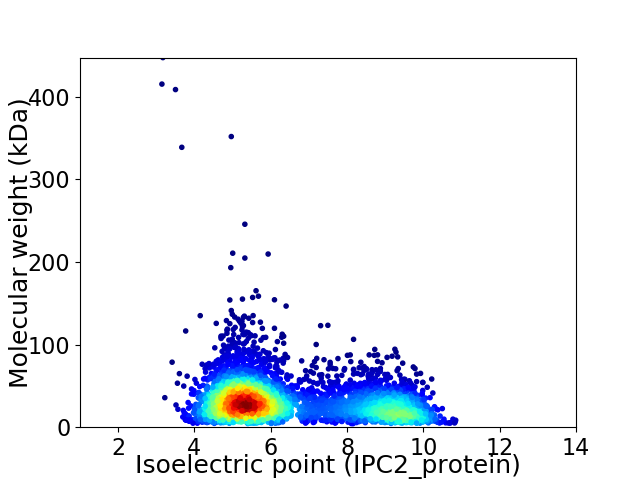
Virtual 2D-PAGE plot for 4359 proteins (isoelectric point calculated using IPC2_protein)
Get csv file with sequences according to given criteria:
* You can choose from 21 different methods for calculating isoelectric point
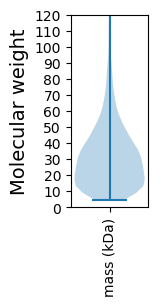
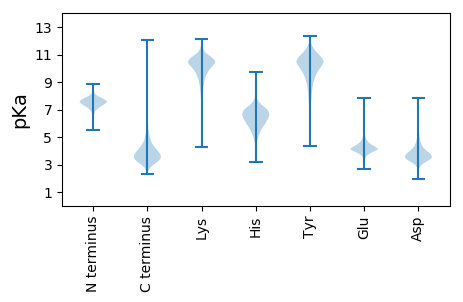
Summary statistics related to proteome-wise predictions


Protein with the lowest isoelectric point:
>tr|A0A0D6AXU5|A0A0D6AXU5_RHOSU Uncharacterized protein OS=Rhodovulum sulfidophilum OX=35806 GN=NHU_00421 PE=4 SV=1
MM1 pKa = 7.23TVNNTLRR8 pKa = 11.84GATAAICIVFGAGTASAAVIDD29 pKa = 4.69LGFVLDD35 pKa = 4.32GSGSVSSYY43 pKa = 11.59DD44 pKa = 3.46FDD46 pKa = 3.99SATAALSAALSQIPTSGDD64 pKa = 2.74NEE66 pKa = 3.91YY67 pKa = 10.61RR68 pKa = 11.84VAVTSYY74 pKa = 10.13GYY76 pKa = 10.55SSYY79 pKa = 10.9TVVPPTVVTAANIASIQSTVLTAYY103 pKa = 9.81KK104 pKa = 10.38DD105 pKa = 3.59DD106 pKa = 4.56GGTDD110 pKa = 3.11TAGAITYY117 pKa = 8.42ITDD120 pKa = 4.01LFLDD124 pKa = 4.83DD125 pKa = 5.04GLGDD129 pKa = 3.51TTLINITTDD138 pKa = 3.51GSPNSQSLTEE148 pKa = 4.14NAALTANTAGVDD160 pKa = 4.5GISLEE165 pKa = 4.28AVGSGVSSPYY175 pKa = 10.63ALSNMARR182 pKa = 11.84IAGLGTSGDD191 pKa = 3.39ADD193 pKa = 3.72AGVIAADD200 pKa = 4.92LDD202 pKa = 4.17SLPNATDD209 pKa = 3.11TGFVIPVADD218 pKa = 4.56FDD220 pKa = 4.91AYY222 pKa = 10.52GAAIEE227 pKa = 4.41AKK229 pKa = 9.24IGQVIDD235 pKa = 3.73DD236 pKa = 4.03TGGDD240 pKa = 3.53TGVVPLPAAMPMLLAGLGVFGFVRR264 pKa = 11.84RR265 pKa = 11.84RR266 pKa = 11.84QTAGG270 pKa = 2.89
MM1 pKa = 7.23TVNNTLRR8 pKa = 11.84GATAAICIVFGAGTASAAVIDD29 pKa = 4.69LGFVLDD35 pKa = 4.32GSGSVSSYY43 pKa = 11.59DD44 pKa = 3.46FDD46 pKa = 3.99SATAALSAALSQIPTSGDD64 pKa = 2.74NEE66 pKa = 3.91YY67 pKa = 10.61RR68 pKa = 11.84VAVTSYY74 pKa = 10.13GYY76 pKa = 10.55SSYY79 pKa = 10.9TVVPPTVVTAANIASIQSTVLTAYY103 pKa = 9.81KK104 pKa = 10.38DD105 pKa = 3.59DD106 pKa = 4.56GGTDD110 pKa = 3.11TAGAITYY117 pKa = 8.42ITDD120 pKa = 4.01LFLDD124 pKa = 4.83DD125 pKa = 5.04GLGDD129 pKa = 3.51TTLINITTDD138 pKa = 3.51GSPNSQSLTEE148 pKa = 4.14NAALTANTAGVDD160 pKa = 4.5GISLEE165 pKa = 4.28AVGSGVSSPYY175 pKa = 10.63ALSNMARR182 pKa = 11.84IAGLGTSGDD191 pKa = 3.39ADD193 pKa = 3.72AGVIAADD200 pKa = 4.92LDD202 pKa = 4.17SLPNATDD209 pKa = 3.11TGFVIPVADD218 pKa = 4.56FDD220 pKa = 4.91AYY222 pKa = 10.52GAAIEE227 pKa = 4.41AKK229 pKa = 9.24IGQVIDD235 pKa = 3.73DD236 pKa = 4.03TGGDD240 pKa = 3.53TGVVPLPAAMPMLLAGLGVFGFVRR264 pKa = 11.84RR265 pKa = 11.84RR266 pKa = 11.84QTAGG270 pKa = 2.89
Molecular weight: 26.86 kDa
Isoelectric point according different methods:
Protein with the highest isoelectric point:
>tr|A0A0D6B961|A0A0D6B961_RHOSU Radical SAM domain protein OS=Rhodovulum sulfidophilum OX=35806 GN=NHU_04221 PE=4 SV=1
MM1 pKa = 7.98RR2 pKa = 11.84GQLSVRR8 pKa = 11.84ISLPRR13 pKa = 11.84WRR15 pKa = 11.84LAVAIVAVRR24 pKa = 11.84VFAVVPAQIPARR36 pKa = 11.84WVRR39 pKa = 11.84GVGGWVARR47 pKa = 11.84GVRR50 pKa = 11.84VKK52 pKa = 10.6RR53 pKa = 11.84SRR55 pKa = 11.84GKK57 pKa = 9.64PRR59 pKa = 11.84LLVGGWQATGDD70 pKa = 3.78GSPPHH75 pKa = 6.59SLPKK79 pKa = 9.42GAKK82 pKa = 8.72SAVVRR87 pKa = 11.84PKK89 pKa = 10.42EE90 pKa = 3.73
MM1 pKa = 7.98RR2 pKa = 11.84GQLSVRR8 pKa = 11.84ISLPRR13 pKa = 11.84WRR15 pKa = 11.84LAVAIVAVRR24 pKa = 11.84VFAVVPAQIPARR36 pKa = 11.84WVRR39 pKa = 11.84GVGGWVARR47 pKa = 11.84GVRR50 pKa = 11.84VKK52 pKa = 10.6RR53 pKa = 11.84SRR55 pKa = 11.84GKK57 pKa = 9.64PRR59 pKa = 11.84LLVGGWQATGDD70 pKa = 3.78GSPPHH75 pKa = 6.59SLPKK79 pKa = 9.42GAKK82 pKa = 8.72SAVVRR87 pKa = 11.84PKK89 pKa = 10.42EE90 pKa = 3.73
Molecular weight: 9.72 kDa
Isoelectric point according different methods:
Peptides (in silico digests for buttom-up proteomics)
Below you can find in silico digests of the whole proteome with Trypsin, Chymotrypsin, Trypsin+LysC, LysN, ArgC proteases suitable for different mass spec machines.| Try ESI |
 |
|---|
| ChTry ESI |
 |
|---|
| ArgC ESI |
 |
|---|
| LysN ESI |
 |
|---|
| TryLysC ESI |
 |
|---|
| Try MALDI |
 |
|---|
| ChTry MALDI |
 |
|---|
| ArgC MALDI |
 |
|---|
| LysN MALDI |
 |
|---|
| TryLysC MALDI |
 |
|---|
| Try LTQ |
 |
|---|
| ChTry LTQ |
 |
|---|
| ArgC LTQ |
 |
|---|
| LysN LTQ |
 |
|---|
| TryLysC LTQ |
 |
|---|
| Try MSlow |
 |
|---|
| ChTry MSlow |
 |
|---|
| ArgC MSlow |
 |
|---|
| LysN MSlow |
 |
|---|
| TryLysC MSlow |
 |
|---|
| Try MShigh |
 |
|---|
| ChTry MShigh |
 |
|---|
| ArgC MShigh |
 |
|---|
| LysN MShigh |
 |
|---|
| TryLysC MShigh |
 |
|---|
General Statistics
Number of major isoforms |
Number of additional isoforms |
Number of all proteins |
Number of amino acids |
Min. Seq. Length |
Max. Seq. Length |
Avg. Seq. Length |
Avg. Mol. Weight |
|---|---|---|---|---|---|---|---|
0 |
1350422 |
39 |
4373 |
309.8 |
33.45 |
Amino acid frequency
Ala |
Cys |
Asp |
Glu |
Phe |
Gly |
His |
Ile |
Lys |
Leu |
|---|---|---|---|---|---|---|---|---|---|
13.533 ± 0.065 | 0.918 ± 0.013 |
5.829 ± 0.037 | 6.052 ± 0.033 |
3.501 ± 0.021 | 9.081 ± 0.054 |
1.955 ± 0.019 | 4.738 ± 0.028 |
2.584 ± 0.033 | 10.523 ± 0.048 |
Met |
Asn |
Gln |
Pro |
Arg |
Ser |
Thr |
Val |
Trp |
Tyr |
|---|---|---|---|---|---|---|---|---|---|
2.597 ± 0.021 | 2.117 ± 0.021 |
5.567 ± 0.039 | 2.769 ± 0.02 |
7.832 ± 0.057 | 4.926 ± 0.034 |
5.168 ± 0.043 | 6.919 ± 0.031 |
1.378 ± 0.015 | 2.012 ± 0.019 |
Most of the basic statistics you can see at this page can be downloaded from this CSV file
Proteome-pI is available under Creative Commons Attribution-NoDerivs license, for more details see here
| Reference: Kozlowski LP. Proteome-pI 2.0: Proteome Isoelectric Point Database Update. Nucleic Acids Res. 2021, doi: 10.1093/nar/gkab944 | Contact: Lukasz P. Kozlowski |
