Intrasporangium calvum (strain ATCC 23552 / DSM 43043 / JCM 3097 / NBRC 12989 / 7 KIP)
Taxonomy: cellular organisms; Bacteria; Terrabacteria group; Actinobacteria; Actinomycetia; Micrococcales; Intrasporangiaceae; Intrasporangium; Intrasporangium calvum
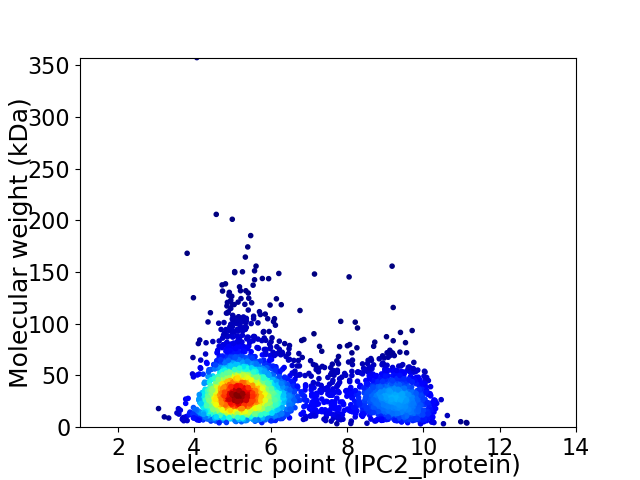
Average proteome isoelectric point is 6.23
Get precalculated fractions of proteins

Virtual 2D-PAGE plot for 3551 proteins (isoelectric point calculated using IPC2_protein)
Get csv file with sequences according to given criteria:
* You can choose from 21 different methods for calculating isoelectric point
Summary statistics related to proteome-wise predictions


Protein with the lowest isoelectric point:
>tr|E6S6R1|E6S6R1_INTC7 Cell wall binding repeat 2-containing protein OS=Intrasporangium calvum (strain ATCC 23552 / DSM 43043 / JCM 3097 / NBRC 12989 / 7 KIP) OX=710696 GN=Intca_0240 PE=4 SV=1
MM1 pKa = 7.24KK2 pKa = 10.62VSGRR6 pKa = 11.84LAAALLAAVTTVAVGGSPAVAAPPTNDD33 pKa = 2.79MYY35 pKa = 11.61AGAEE39 pKa = 4.22AIAALPFATTLDD51 pKa = 3.73TTEE54 pKa = 4.24ATTDD58 pKa = 3.51ADD60 pKa = 3.89DD61 pKa = 5.24AEE63 pKa = 5.45LNGQCGAPAMDD74 pKa = 3.48ASVWYY79 pKa = 10.09SYY81 pKa = 8.8TAEE84 pKa = 4.48ADD86 pKa = 3.77SLLLADD92 pKa = 5.04AFEE95 pKa = 5.19SDD97 pKa = 3.77YY98 pKa = 11.6SAGVLVATGAPGNFLVQGCGPGGAGWEE125 pKa = 4.08AMAGEE130 pKa = 4.97TYY132 pKa = 10.63YY133 pKa = 10.29IVVFDD138 pKa = 4.53DD139 pKa = 4.18QEE141 pKa = 6.37DD142 pKa = 4.26GTGNGGTMSLTVDD155 pKa = 3.97VAPPAPAIEE164 pKa = 4.24ATVNPLGWFDD174 pKa = 3.87ARR176 pKa = 11.84TGFATISGTVTCDD189 pKa = 2.87SSADD193 pKa = 3.58FAFVDD198 pKa = 3.48VTLQQRR204 pKa = 11.84VGRR207 pKa = 11.84FIVRR211 pKa = 11.84GYY213 pKa = 10.83GGTEE217 pKa = 4.01VFCDD221 pKa = 3.99GTPQPWSAEE230 pKa = 3.77ISGEE234 pKa = 3.95TGLFKK239 pKa = 10.72GGRR242 pKa = 11.84ALSVSFSVACNSGGCSEE259 pKa = 4.73YY260 pKa = 10.61FDD262 pKa = 3.77EE263 pKa = 4.98TEE265 pKa = 4.14VRR267 pKa = 11.84LTGKK271 pKa = 10.02KK272 pKa = 8.96RR273 pKa = 3.18
MM1 pKa = 7.24KK2 pKa = 10.62VSGRR6 pKa = 11.84LAAALLAAVTTVAVGGSPAVAAPPTNDD33 pKa = 2.79MYY35 pKa = 11.61AGAEE39 pKa = 4.22AIAALPFATTLDD51 pKa = 3.73TTEE54 pKa = 4.24ATTDD58 pKa = 3.51ADD60 pKa = 3.89DD61 pKa = 5.24AEE63 pKa = 5.45LNGQCGAPAMDD74 pKa = 3.48ASVWYY79 pKa = 10.09SYY81 pKa = 8.8TAEE84 pKa = 4.48ADD86 pKa = 3.77SLLLADD92 pKa = 5.04AFEE95 pKa = 5.19SDD97 pKa = 3.77YY98 pKa = 11.6SAGVLVATGAPGNFLVQGCGPGGAGWEE125 pKa = 4.08AMAGEE130 pKa = 4.97TYY132 pKa = 10.63YY133 pKa = 10.29IVVFDD138 pKa = 4.53DD139 pKa = 4.18QEE141 pKa = 6.37DD142 pKa = 4.26GTGNGGTMSLTVDD155 pKa = 3.97VAPPAPAIEE164 pKa = 4.24ATVNPLGWFDD174 pKa = 3.87ARR176 pKa = 11.84TGFATISGTVTCDD189 pKa = 2.87SSADD193 pKa = 3.58FAFVDD198 pKa = 3.48VTLQQRR204 pKa = 11.84VGRR207 pKa = 11.84FIVRR211 pKa = 11.84GYY213 pKa = 10.83GGTEE217 pKa = 4.01VFCDD221 pKa = 3.99GTPQPWSAEE230 pKa = 3.77ISGEE234 pKa = 3.95TGLFKK239 pKa = 10.72GGRR242 pKa = 11.84ALSVSFSVACNSGGCSEE259 pKa = 4.73YY260 pKa = 10.61FDD262 pKa = 3.77EE263 pKa = 4.98TEE265 pKa = 4.14VRR267 pKa = 11.84LTGKK271 pKa = 10.02KK272 pKa = 8.96RR273 pKa = 3.18
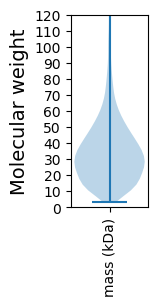
Molecular weight: 27.86 kDa
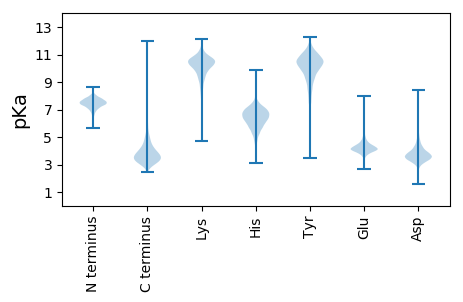
Isoelectric point according different methods:
Protein with the highest isoelectric point:
>tr|E6SDF0|E6SDF0_INTC7 Uncharacterized protein OS=Intrasporangium calvum (strain ATCC 23552 / DSM 43043 / JCM 3097 / NBRC 12989 / 7 KIP) OX=710696 GN=Intca_1049 PE=4 SV=1
MM1 pKa = 8.09RR2 pKa = 11.84LRR4 pKa = 11.84SSLVLARR11 pKa = 11.84MLLRR15 pKa = 11.84FFIRR19 pKa = 11.84RR20 pKa = 11.84VTRR23 pKa = 11.84MGVLRR28 pKa = 11.84STAVKK33 pKa = 9.81VAHH36 pKa = 6.12RR37 pKa = 11.84TT38 pKa = 3.49
MM1 pKa = 8.09RR2 pKa = 11.84LRR4 pKa = 11.84SSLVLARR11 pKa = 11.84MLLRR15 pKa = 11.84FFIRR19 pKa = 11.84RR20 pKa = 11.84VTRR23 pKa = 11.84MGVLRR28 pKa = 11.84STAVKK33 pKa = 9.81VAHH36 pKa = 6.12RR37 pKa = 11.84TT38 pKa = 3.49
Molecular weight: 4.5 kDa
Isoelectric point according different methods:
Peptides (in silico digests for buttom-up proteomics)
Below you can find in silico digests of the whole proteome with Trypsin, Chymotrypsin, Trypsin+LysC, LysN, ArgC proteases suitable for different mass spec machines.| Try ESI |
 |
|---|
| ChTry ESI |
 |
|---|
| ArgC ESI |
 |
|---|
| LysN ESI |
 |
|---|
| TryLysC ESI |
 |
|---|
| Try MALDI |
 |
|---|
| ChTry MALDI |
 |
|---|
| ArgC MALDI |
 |
|---|
| LysN MALDI |
 |
|---|
| TryLysC MALDI |
 |
|---|
| Try LTQ |
 |
|---|
| ChTry LTQ |
 |
|---|
| ArgC LTQ |
 |
|---|
| LysN LTQ |
 |
|---|
| TryLysC LTQ |
 |
|---|
| Try MSlow |
 |
|---|
| ChTry MSlow |
 |
|---|
| ArgC MSlow |
 |
|---|
| LysN MSlow |
 |
|---|
| TryLysC MSlow |
 |
|---|
| Try MShigh |
 |
|---|
| ChTry MShigh |
 |
|---|
| ArgC MShigh |
 |
|---|
| LysN MShigh |
 |
|---|
| TryLysC MShigh |
 |
|---|
General Statistics
Number of major isoforms |
Number of additional isoforms |
Number of all proteins |
Number of amino acids |
Min. Seq. Length |
Max. Seq. Length |
Avg. Seq. Length |
Avg. Mol. Weight |
|---|---|---|---|---|---|---|---|
0 |
1195564 |
31 |
3498 |
336.7 |
36.02 |
Amino acid frequency
Ala |
Cys |
Asp |
Glu |
Phe |
Gly |
His |
Ile |
Lys |
Leu |
|---|---|---|---|---|---|---|---|---|---|
13.123 ± 0.058 | 0.669 ± 0.011 |
6.145 ± 0.037 | 5.651 ± 0.039 |
2.774 ± 0.023 | 9.278 ± 0.033 |
2.293 ± 0.02 | 3.676 ± 0.028 |
1.935 ± 0.031 | 10.217 ± 0.046 |
Met |
Asn |
Gln |
Pro |
Arg |
Ser |
Thr |
Val |
Trp |
Tyr |
|---|---|---|---|---|---|---|---|---|---|
1.81 ± 0.015 | 1.72 ± 0.022 |
5.805 ± 0.033 | 2.737 ± 0.021 |
7.875 ± 0.045 | 5.459 ± 0.029 |
6.097 ± 0.035 | 9.38 ± 0.04 |
1.513 ± 0.021 | 1.845 ± 0.018 |
Most of the basic statistics you can see at this page can be downloaded from this CSV file
Proteome-pI is available under Creative Commons Attribution-NoDerivs license, for more details see here
| Reference: Kozlowski LP. Proteome-pI 2.0: Proteome Isoelectric Point Database Update. Nucleic Acids Res. 2021, doi: 10.1093/nar/gkab944 | Contact: Lukasz P. Kozlowski |
