Hwanghaeicola aestuarii
Taxonomy: cellular organisms; Bacteria; Proteobacteria; Alphaproteobacteria; Rhodobacterales; Roseobacteraceae; Hwanghaeicola
Average proteome isoelectric point is 6.17
Get precalculated fractions of proteins

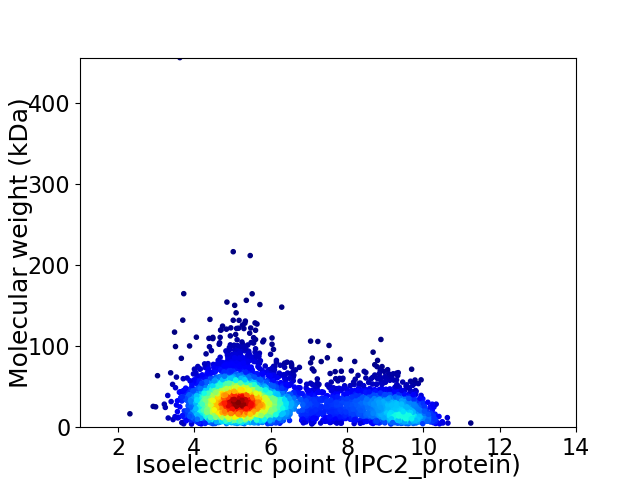
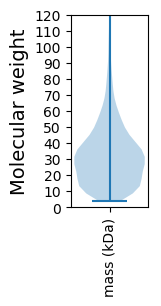
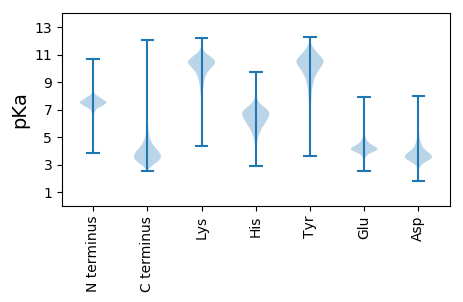
Virtual 2D-PAGE plot for 4336 proteins (isoelectric point calculated using IPC2_protein)
Get csv file with sequences according to given criteria:
* You can choose from 21 different methods for calculating isoelectric point
Summary statistics related to proteome-wise predictions


Protein with the lowest isoelectric point:
>tr|A0A2W7MUH2|A0A2W7MUH2_9RHOB Plasmid stability protein OS=Hwanghaeicola aestuarii OX=568105 GN=LX81_03862 PE=4 SV=1
MM1 pKa = 7.48KK2 pKa = 10.41SVIITIGLLAAGVTGAEE19 pKa = 4.06AQQLRR24 pKa = 11.84LMTGPQGGSWYY35 pKa = 9.15PLGGAIQGMASDD47 pKa = 4.61AGIASIQVLPGGGVANVQGVQNGDD71 pKa = 3.29ADD73 pKa = 4.32LGFANSISTVDD84 pKa = 4.33AIAGRR89 pKa = 11.84EE90 pKa = 4.15PFTGAADD97 pKa = 3.78NVCNIATLYY106 pKa = 8.85PQYY109 pKa = 10.44FQIVTTEE116 pKa = 3.96GTGIEE121 pKa = 4.31TPEE124 pKa = 4.12DD125 pKa = 3.52FAGKK129 pKa = 10.01RR130 pKa = 11.84LATQPVGNTAEE141 pKa = 4.17QVTRR145 pKa = 11.84AVLEE149 pKa = 4.36TAGLSYY155 pKa = 11.48DD156 pKa = 3.96DD157 pKa = 5.57LSAVDD162 pKa = 3.85YY163 pKa = 11.08VSYY166 pKa = 11.27SDD168 pKa = 5.2GVSLMQDD175 pKa = 3.09NNSDD179 pKa = 3.29ILTLGTTIPASAIMDD194 pKa = 4.7LANSSDD200 pKa = 3.53VSLVTLEE207 pKa = 3.9QSFIDD212 pKa = 5.25DD213 pKa = 3.28MRR215 pKa = 11.84EE216 pKa = 4.03NINPGYY222 pKa = 8.29TAITIPGGTYY232 pKa = 9.66PGQDD236 pKa = 3.07EE237 pKa = 5.16DD238 pKa = 4.14VTAVGYY244 pKa = 7.65ATHH247 pKa = 6.37VVARR251 pKa = 11.84CDD253 pKa = 3.66LDD255 pKa = 3.89PEE257 pKa = 4.45VVEE260 pKa = 6.36GILTQMWEE268 pKa = 4.47KK269 pKa = 10.38KK270 pKa = 10.61DD271 pKa = 3.64DD272 pKa = 3.55MAAIATVMSDD282 pKa = 3.3LTLEE286 pKa = 4.69SMAQDD291 pKa = 3.44VGVPMHH297 pKa = 7.25DD298 pKa = 3.55GATAFYY304 pKa = 9.14EE305 pKa = 4.27AQGVQQQ311 pKa = 3.96
MM1 pKa = 7.48KK2 pKa = 10.41SVIITIGLLAAGVTGAEE19 pKa = 4.06AQQLRR24 pKa = 11.84LMTGPQGGSWYY35 pKa = 9.15PLGGAIQGMASDD47 pKa = 4.61AGIASIQVLPGGGVANVQGVQNGDD71 pKa = 3.29ADD73 pKa = 4.32LGFANSISTVDD84 pKa = 4.33AIAGRR89 pKa = 11.84EE90 pKa = 4.15PFTGAADD97 pKa = 3.78NVCNIATLYY106 pKa = 8.85PQYY109 pKa = 10.44FQIVTTEE116 pKa = 3.96GTGIEE121 pKa = 4.31TPEE124 pKa = 4.12DD125 pKa = 3.52FAGKK129 pKa = 10.01RR130 pKa = 11.84LATQPVGNTAEE141 pKa = 4.17QVTRR145 pKa = 11.84AVLEE149 pKa = 4.36TAGLSYY155 pKa = 11.48DD156 pKa = 3.96DD157 pKa = 5.57LSAVDD162 pKa = 3.85YY163 pKa = 11.08VSYY166 pKa = 11.27SDD168 pKa = 5.2GVSLMQDD175 pKa = 3.09NNSDD179 pKa = 3.29ILTLGTTIPASAIMDD194 pKa = 4.7LANSSDD200 pKa = 3.53VSLVTLEE207 pKa = 3.9QSFIDD212 pKa = 5.25DD213 pKa = 3.28MRR215 pKa = 11.84EE216 pKa = 4.03NINPGYY222 pKa = 8.29TAITIPGGTYY232 pKa = 9.66PGQDD236 pKa = 3.07EE237 pKa = 5.16DD238 pKa = 4.14VTAVGYY244 pKa = 7.65ATHH247 pKa = 6.37VVARR251 pKa = 11.84CDD253 pKa = 3.66LDD255 pKa = 3.89PEE257 pKa = 4.45VVEE260 pKa = 6.36GILTQMWEE268 pKa = 4.47KK269 pKa = 10.38KK270 pKa = 10.61DD271 pKa = 3.64DD272 pKa = 3.55MAAIATVMSDD282 pKa = 3.3LTLEE286 pKa = 4.69SMAQDD291 pKa = 3.44VGVPMHH297 pKa = 7.25DD298 pKa = 3.55GATAFYY304 pKa = 9.14EE305 pKa = 4.27AQGVQQQ311 pKa = 3.96
Molecular weight: 32.36 kDa
Isoelectric point according different methods:
Protein with the highest isoelectric point:
>tr|A0A2W7MX97|A0A2W7MX97_9RHOB LuxR family transcriptional regulator OS=Hwanghaeicola aestuarii OX=568105 GN=LX81_03688 PE=4 SV=1
MM1 pKa = 7.45KK2 pKa = 9.61RR3 pKa = 11.84TFQPSNLVRR12 pKa = 11.84KK13 pKa = 9.18RR14 pKa = 11.84RR15 pKa = 11.84HH16 pKa = 4.42GFRR19 pKa = 11.84ARR21 pKa = 11.84MATKK25 pKa = 10.37AGRR28 pKa = 11.84KK29 pKa = 8.54ILNARR34 pKa = 11.84RR35 pKa = 11.84ARR37 pKa = 11.84GRR39 pKa = 11.84KK40 pKa = 9.07SLSAA44 pKa = 3.93
MM1 pKa = 7.45KK2 pKa = 9.61RR3 pKa = 11.84TFQPSNLVRR12 pKa = 11.84KK13 pKa = 9.18RR14 pKa = 11.84RR15 pKa = 11.84HH16 pKa = 4.42GFRR19 pKa = 11.84ARR21 pKa = 11.84MATKK25 pKa = 10.37AGRR28 pKa = 11.84KK29 pKa = 8.54ILNARR34 pKa = 11.84RR35 pKa = 11.84ARR37 pKa = 11.84GRR39 pKa = 11.84KK40 pKa = 9.07SLSAA44 pKa = 3.93
Molecular weight: 5.14 kDa
Isoelectric point according different methods:
Peptides (in silico digests for buttom-up proteomics)
Below you can find in silico digests of the whole proteome with Trypsin, Chymotrypsin, Trypsin+LysC, LysN, ArgC proteases suitable for different mass spec machines.| Try ESI |
 |
|---|
| ChTry ESI |
 |
|---|
| ArgC ESI |
 |
|---|
| LysN ESI |
 |
|---|
| TryLysC ESI |
 |
|---|
| Try MALDI |
 |
|---|
| ChTry MALDI |
 |
|---|
| ArgC MALDI |
 |
|---|
| LysN MALDI |
 |
|---|
| TryLysC MALDI |
 |
|---|
| Try LTQ |
 |
|---|
| ChTry LTQ |
 |
|---|
| ArgC LTQ |
 |
|---|
| LysN LTQ |
 |
|---|
| TryLysC LTQ |
 |
|---|
| Try MSlow |
 |
|---|
| ChTry MSlow |
 |
|---|
| ArgC MSlow |
 |
|---|
| LysN MSlow |
 |
|---|
| TryLysC MSlow |
 |
|---|
| Try MShigh |
 |
|---|
| ChTry MShigh |
 |
|---|
| ArgC MShigh |
 |
|---|
| LysN MShigh |
 |
|---|
| TryLysC MShigh |
 |
|---|
General Statistics
Number of major isoforms |
Number of additional isoforms |
Number of all proteins |
Number of amino acids |
Min. Seq. Length |
Max. Seq. Length |
Avg. Seq. Length |
Avg. Mol. Weight |
|---|---|---|---|---|---|---|---|
0 |
1340171 |
39 |
4399 |
309.1 |
33.45 |
Amino acid frequency
Ala |
Cys |
Asp |
Glu |
Phe |
Gly |
His |
Ile |
Lys |
Leu |
|---|---|---|---|---|---|---|---|---|---|
12.807 ± 0.048 | 0.854 ± 0.011 |
6.191 ± 0.038 | 6.201 ± 0.037 |
3.604 ± 0.026 | 9.018 ± 0.038 |
1.972 ± 0.019 | 5.161 ± 0.025 |
2.295 ± 0.028 | 10.086 ± 0.049 |
Met |
Asn |
Gln |
Pro |
Arg |
Ser |
Thr |
Val |
Trp |
Tyr |
|---|---|---|---|---|---|---|---|---|---|
2.609 ± 0.019 | 2.225 ± 0.018 |
5.291 ± 0.029 | 2.682 ± 0.02 |
7.662 ± 0.044 | 5.151 ± 0.023 |
5.431 ± 0.027 | 7.272 ± 0.029 |
1.388 ± 0.016 | 2.1 ± 0.019 |
Most of the basic statistics you can see at this page can be downloaded from this CSV file
Proteome-pI is available under Creative Commons Attribution-NoDerivs license, for more details see here
| Reference: Kozlowski LP. Proteome-pI 2.0: Proteome Isoelectric Point Database Update. Nucleic Acids Res. 2021, doi: 10.1093/nar/gkab944 | Contact: Lukasz P. Kozlowski |
