Filimonas lacunae
Taxonomy: cellular organisms; Bacteria; FCB group; Bacteroidetes/Chlorobi group; Bacteroidetes; Chitinophagia; Chitinophagales; Chitinophagaceae; Filimonas
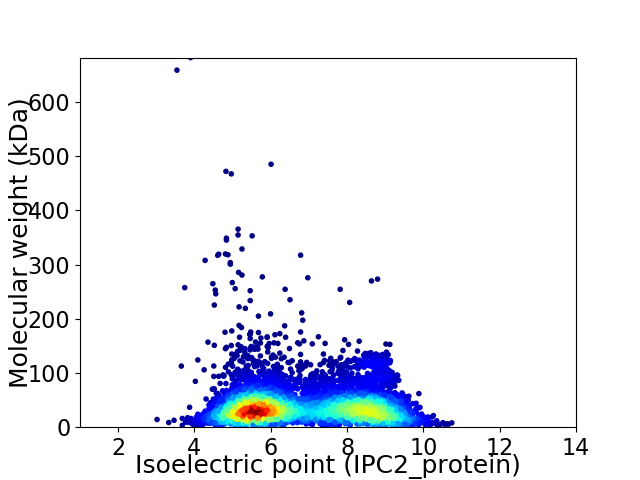
Average proteome isoelectric point is 6.86
Get precalculated fractions of proteins

Virtual 2D-PAGE plot for 6193 proteins (isoelectric point calculated using IPC2_protein)
Get csv file with sequences according to given criteria:
* You can choose from 21 different methods for calculating isoelectric point
Summary statistics related to proteome-wise predictions


Protein with the lowest isoelectric point:
>tr|A0A173MGZ2|A0A173MGZ2_9BACT Acyl dehydratase OS=Filimonas lacunae OX=477680 GN=SAMN05421788_107347 PE=4 SV=1
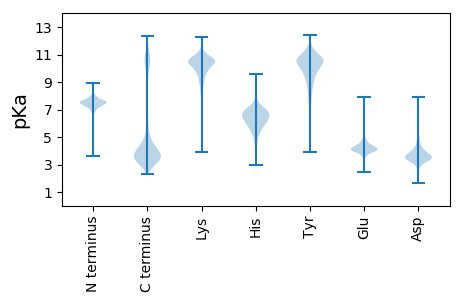
MM1 pKa = 7.65EE2 pKa = 5.37NKK4 pKa = 9.64QSNPYY9 pKa = 10.43YY10 pKa = 10.31IFTQEE15 pKa = 5.13ILDD18 pKa = 3.68SWVQEE23 pKa = 3.7GVQYY27 pKa = 11.29VKK29 pKa = 10.72VAEE32 pKa = 4.66LEE34 pKa = 4.09TGTQEE39 pKa = 4.8KK40 pKa = 10.19YY41 pKa = 10.56YY42 pKa = 10.7EE43 pKa = 5.27LIPDD47 pKa = 4.35PDD49 pKa = 3.92FMGGDD54 pKa = 3.8DD55 pKa = 4.75PIYY58 pKa = 10.21PIGAEE63 pKa = 4.53DD64 pKa = 3.15ITEE67 pKa = 3.98LVEE70 pKa = 4.2IVPHH74 pKa = 6.09AKK76 pKa = 9.84FVVHH80 pKa = 7.04EE81 pKa = 4.77IYY83 pKa = 10.95LDD85 pKa = 3.65MEE87 pKa = 4.78DD88 pKa = 4.18EE89 pKa = 4.38EE90 pKa = 4.65EE91 pKa = 4.05
MM1 pKa = 7.65EE2 pKa = 5.37NKK4 pKa = 9.64QSNPYY9 pKa = 10.43YY10 pKa = 10.31IFTQEE15 pKa = 5.13ILDD18 pKa = 3.68SWVQEE23 pKa = 3.7GVQYY27 pKa = 11.29VKK29 pKa = 10.72VAEE32 pKa = 4.66LEE34 pKa = 4.09TGTQEE39 pKa = 4.8KK40 pKa = 10.19YY41 pKa = 10.56YY42 pKa = 10.7EE43 pKa = 5.27LIPDD47 pKa = 4.35PDD49 pKa = 3.92FMGGDD54 pKa = 3.8DD55 pKa = 4.75PIYY58 pKa = 10.21PIGAEE63 pKa = 4.53DD64 pKa = 3.15ITEE67 pKa = 3.98LVEE70 pKa = 4.2IVPHH74 pKa = 6.09AKK76 pKa = 9.84FVVHH80 pKa = 7.04EE81 pKa = 4.77IYY83 pKa = 10.95LDD85 pKa = 3.65MEE87 pKa = 4.78DD88 pKa = 4.18EE89 pKa = 4.38EE90 pKa = 4.65EE91 pKa = 4.05
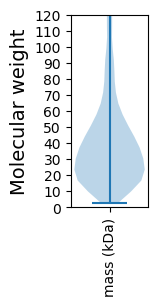
Molecular weight: 10.62 kDa
Isoelectric point according different methods:
Protein with the highest isoelectric point:
>tr|A0A1N7R4I3|A0A1N7R4I3_9BACT Peroxiredoxin OS=Filimonas lacunae OX=477680 GN=SAMN05421788_109112 PE=4 SV=1
MM1 pKa = 6.82NHH3 pKa = 7.58KK4 pKa = 10.54ARR6 pKa = 11.84IWKK9 pKa = 10.08RR10 pKa = 11.84SVPPKK15 pKa = 9.98RR16 pKa = 11.84VLAIRR21 pKa = 11.84LQAMGDD27 pKa = 3.73LVITLPYY34 pKa = 10.06LQALRR39 pKa = 11.84DD40 pKa = 3.97SLPPGTQLDD49 pKa = 4.14LLTRR53 pKa = 11.84QEE55 pKa = 3.9VAAIPQHH62 pKa = 5.7LHH64 pKa = 5.19LFNRR68 pKa = 11.84VFAIGGGRR76 pKa = 11.84VFKK79 pKa = 10.83RR80 pKa = 11.84QFLYY84 pKa = 10.83AIFLLPRR91 pKa = 11.84LMLRR95 pKa = 11.84RR96 pKa = 11.84YY97 pKa = 10.22DD98 pKa = 4.15VVLDD102 pKa = 3.71LQNNKK107 pKa = 9.39LSRR110 pKa = 11.84MVRR113 pKa = 11.84LVLRR117 pKa = 11.84PRR119 pKa = 11.84AWTEE123 pKa = 3.34FDD125 pKa = 3.25RR126 pKa = 11.84LSPISAGLRR135 pKa = 11.84NQNTIAAVGLGNHH148 pKa = 6.81AAAFHH153 pKa = 6.26LCLRR157 pKa = 11.84EE158 pKa = 4.05PVDD161 pKa = 3.34TAGLLRR167 pKa = 11.84RR168 pKa = 11.84NGWDD172 pKa = 3.33GVSGLVVLNPAGAFATRR189 pKa = 11.84HH190 pKa = 4.86WPVEE194 pKa = 4.12NYY196 pKa = 10.23VSFARR201 pKa = 11.84QWLQHH206 pKa = 5.91FPQTQFLVIGVPLVAEE222 pKa = 4.23KK223 pKa = 10.05ATFFQRR229 pKa = 11.84QLGGRR234 pKa = 11.84LINLVSKK241 pKa = 6.33TTPVEE246 pKa = 4.11AFALLQQVRR255 pKa = 11.84LTLTEE260 pKa = 4.53DD261 pKa = 3.14SGLMHH266 pKa = 6.7MSWVQGIATLALFGSTRR283 pKa = 11.84SDD285 pKa = 2.45WSAPLGRR292 pKa = 11.84HH293 pKa = 5.34SLLLHH298 pKa = 6.79SGDD301 pKa = 4.59LPCGSCMRR309 pKa = 11.84EE310 pKa = 3.71QCLHH314 pKa = 6.45GNTPCLTRR322 pKa = 11.84YY323 pKa = 7.98TPEE326 pKa = 3.8QVLAAALALVAAATAGAA343 pKa = 3.97
MM1 pKa = 6.82NHH3 pKa = 7.58KK4 pKa = 10.54ARR6 pKa = 11.84IWKK9 pKa = 10.08RR10 pKa = 11.84SVPPKK15 pKa = 9.98RR16 pKa = 11.84VLAIRR21 pKa = 11.84LQAMGDD27 pKa = 3.73LVITLPYY34 pKa = 10.06LQALRR39 pKa = 11.84DD40 pKa = 3.97SLPPGTQLDD49 pKa = 4.14LLTRR53 pKa = 11.84QEE55 pKa = 3.9VAAIPQHH62 pKa = 5.7LHH64 pKa = 5.19LFNRR68 pKa = 11.84VFAIGGGRR76 pKa = 11.84VFKK79 pKa = 10.83RR80 pKa = 11.84QFLYY84 pKa = 10.83AIFLLPRR91 pKa = 11.84LMLRR95 pKa = 11.84RR96 pKa = 11.84YY97 pKa = 10.22DD98 pKa = 4.15VVLDD102 pKa = 3.71LQNNKK107 pKa = 9.39LSRR110 pKa = 11.84MVRR113 pKa = 11.84LVLRR117 pKa = 11.84PRR119 pKa = 11.84AWTEE123 pKa = 3.34FDD125 pKa = 3.25RR126 pKa = 11.84LSPISAGLRR135 pKa = 11.84NQNTIAAVGLGNHH148 pKa = 6.81AAAFHH153 pKa = 6.26LCLRR157 pKa = 11.84EE158 pKa = 4.05PVDD161 pKa = 3.34TAGLLRR167 pKa = 11.84RR168 pKa = 11.84NGWDD172 pKa = 3.33GVSGLVVLNPAGAFATRR189 pKa = 11.84HH190 pKa = 4.86WPVEE194 pKa = 4.12NYY196 pKa = 10.23VSFARR201 pKa = 11.84QWLQHH206 pKa = 5.91FPQTQFLVIGVPLVAEE222 pKa = 4.23KK223 pKa = 10.05ATFFQRR229 pKa = 11.84QLGGRR234 pKa = 11.84LINLVSKK241 pKa = 6.33TTPVEE246 pKa = 4.11AFALLQQVRR255 pKa = 11.84LTLTEE260 pKa = 4.53DD261 pKa = 3.14SGLMHH266 pKa = 6.7MSWVQGIATLALFGSTRR283 pKa = 11.84SDD285 pKa = 2.45WSAPLGRR292 pKa = 11.84HH293 pKa = 5.34SLLLHH298 pKa = 6.79SGDD301 pKa = 4.59LPCGSCMRR309 pKa = 11.84EE310 pKa = 3.71QCLHH314 pKa = 6.45GNTPCLTRR322 pKa = 11.84YY323 pKa = 7.98TPEE326 pKa = 3.8QVLAAALALVAAATAGAA343 pKa = 3.97
Molecular weight: 38.12 kDa
Isoelectric point according different methods:
Peptides (in silico digests for buttom-up proteomics)
Below you can find in silico digests of the whole proteome with Trypsin, Chymotrypsin, Trypsin+LysC, LysN, ArgC proteases suitable for different mass spec machines.| Try ESI |
 |
|---|
| ChTry ESI |
 |
|---|
| ArgC ESI |
 |
|---|
| LysN ESI |
 |
|---|
| TryLysC ESI |
 |
|---|
| Try MALDI |
 |
|---|
| ChTry MALDI |
 |
|---|
| ArgC MALDI |
 |
|---|
| LysN MALDI |
 |
|---|
| TryLysC MALDI |
 |
|---|
| Try LTQ |
 |
|---|
| ChTry LTQ |
 |
|---|
| ArgC LTQ |
 |
|---|
| LysN LTQ |
 |
|---|
| TryLysC LTQ |
 |
|---|
| Try MSlow |
 |
|---|
| ChTry MSlow |
 |
|---|
| ArgC MSlow |
 |
|---|
| LysN MSlow |
 |
|---|
| TryLysC MSlow |
 |
|---|
| Try MShigh |
 |
|---|
| ChTry MShigh |
 |
|---|
| ArgC MShigh |
 |
|---|
| LysN MShigh |
 |
|---|
| TryLysC MShigh |
 |
|---|
General Statistics
Number of major isoforms |
Number of additional isoforms |
Number of all proteins |
Number of amino acids |
Min. Seq. Length |
Max. Seq. Length |
Avg. Seq. Length |
Avg. Mol. Weight |
|---|---|---|---|---|---|---|---|
0 |
2362209 |
26 |
6707 |
381.4 |
42.49 |
Amino acid frequency
Ala |
Cys |
Asp |
Glu |
Phe |
Gly |
His |
Ile |
Lys |
Leu |
|---|---|---|---|---|---|---|---|---|---|
8.383 ± 0.036 | 0.896 ± 0.011 |
4.929 ± 0.023 | 5.111 ± 0.044 |
4.433 ± 0.024 | 6.969 ± 0.035 |
1.984 ± 0.019 | 6.33 ± 0.027 |
6.053 ± 0.041 | 9.291 ± 0.049 |
Met |
Asn |
Gln |
Pro |
Arg |
Ser |
Thr |
Val |
Trp |
Tyr |
|---|---|---|---|---|---|---|---|---|---|
2.263 ± 0.018 | 5.487 ± 0.029 |
3.923 ± 0.019 | 4.304 ± 0.025 |
3.96 ± 0.028 | 6.424 ± 0.036 |
6.649 ± 0.07 | 6.879 ± 0.037 |
1.308 ± 0.011 | 4.423 ± 0.024 |
Most of the basic statistics you can see at this page can be downloaded from this CSV file
Proteome-pI is available under Creative Commons Attribution-NoDerivs license, for more details see here
| Reference: Kozlowski LP. Proteome-pI 2.0: Proteome Isoelectric Point Database Update. Nucleic Acids Res. 2021, doi: 10.1093/nar/gkab944 | Contact: Lukasz P. Kozlowski |
