Flavobacterium phage 2A
Taxonomy: Viruses; Duplodnaviria; Heunggongvirae; Uroviricota; Caudoviricetes; Caudovirales; Siphoviridae; Unahavirus; Flavobacterium virus 2A
Average proteome isoelectric point is 7.09
Get precalculated fractions of proteins
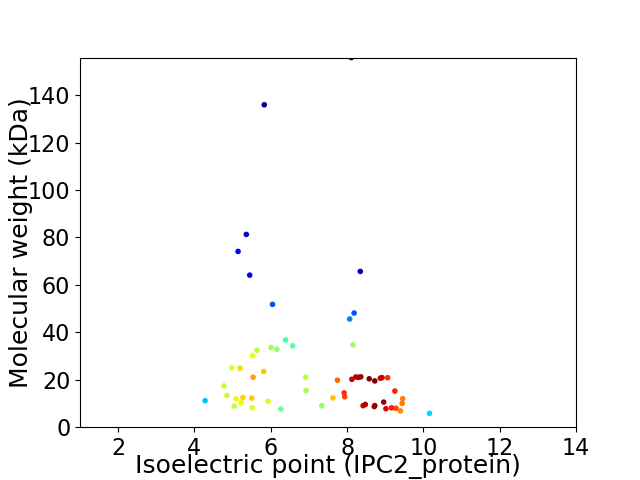
Virtual 2D-PAGE plot for 61 proteins (isoelectric point calculated using IPC2_protein)
Get csv file with sequences according to given criteria:
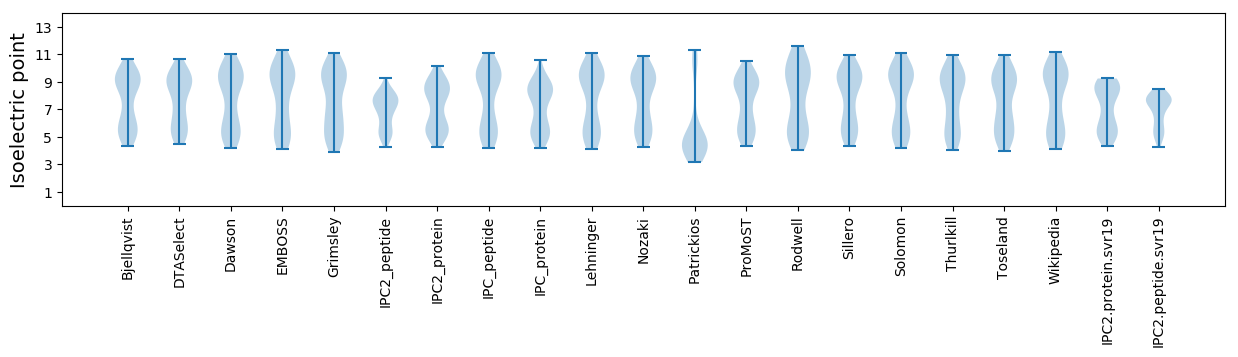
* You can choose from 21 different methods for calculating isoelectric point
Summary statistics related to proteome-wise predictions
Protein with the lowest isoelectric point:
>tr|A0A1B0WMM5|A0A1B0WMM5_9CAUD Transcriptional regulator OS=Flavobacterium phage 2A OX=1792273 PE=4 SV=1
MM1 pKa = 8.06RR2 pKa = 11.84NRR4 pKa = 11.84IYY6 pKa = 10.25IQYY9 pKa = 9.89SGKK12 pKa = 8.17ITKK15 pKa = 8.21NTIALMEE22 pKa = 4.56TYY24 pKa = 10.11LICDD28 pKa = 4.78FIGRR32 pKa = 11.84TVIDD36 pKa = 3.57GRR38 pKa = 11.84RR39 pKa = 11.84AYY41 pKa = 9.61IDD43 pKa = 3.9LKK45 pKa = 10.97QSEE48 pKa = 4.73NPNLDD53 pKa = 3.37EE54 pKa = 4.11VSQFILALDD63 pKa = 3.84GTDD66 pKa = 6.66FITFWGYY73 pKa = 9.86PLEE76 pKa = 4.99DD77 pKa = 3.88GSNITTNEE85 pKa = 3.77DD86 pKa = 3.29FKK88 pKa = 11.48DD89 pKa = 4.53FSISEE94 pKa = 3.79IDD96 pKa = 3.12AA97 pKa = 4.2
MM1 pKa = 8.06RR2 pKa = 11.84NRR4 pKa = 11.84IYY6 pKa = 10.25IQYY9 pKa = 9.89SGKK12 pKa = 8.17ITKK15 pKa = 8.21NTIALMEE22 pKa = 4.56TYY24 pKa = 10.11LICDD28 pKa = 4.78FIGRR32 pKa = 11.84TVIDD36 pKa = 3.57GRR38 pKa = 11.84RR39 pKa = 11.84AYY41 pKa = 9.61IDD43 pKa = 3.9LKK45 pKa = 10.97QSEE48 pKa = 4.73NPNLDD53 pKa = 3.37EE54 pKa = 4.11VSQFILALDD63 pKa = 3.84GTDD66 pKa = 6.66FITFWGYY73 pKa = 9.86PLEE76 pKa = 4.99DD77 pKa = 3.88GSNITTNEE85 pKa = 3.77DD86 pKa = 3.29FKK88 pKa = 11.48DD89 pKa = 4.53FSISEE94 pKa = 3.79IDD96 pKa = 3.12AA97 pKa = 4.2
Molecular weight: 11.17 kDa
Isoelectric point according different methods:
Protein with the highest isoelectric point:
>tr|A0A1B0WM67|A0A1B0WM67_9CAUD Uncharacterized protein OS=Flavobacterium phage 2A OX=1792273 PE=4 SV=1
MM1 pKa = 7.7FYY3 pKa = 10.51FISATFSTLKK13 pKa = 10.55KK14 pKa = 8.98ITPLKK19 pKa = 10.68SRR21 pKa = 11.84VEE23 pKa = 3.87RR24 pKa = 11.84LRR26 pKa = 11.84DD27 pKa = 3.43KK28 pKa = 10.62KK29 pKa = 11.11KK30 pKa = 11.05KK31 pKa = 8.3MNLYY35 pKa = 9.6IIKK38 pKa = 10.36KK39 pKa = 8.87IFFYY43 pKa = 9.63VQRR46 pKa = 11.84II47 pKa = 3.54
MM1 pKa = 7.7FYY3 pKa = 10.51FISATFSTLKK13 pKa = 10.55KK14 pKa = 8.98ITPLKK19 pKa = 10.68SRR21 pKa = 11.84VEE23 pKa = 3.87RR24 pKa = 11.84LRR26 pKa = 11.84DD27 pKa = 3.43KK28 pKa = 10.62KK29 pKa = 11.11KK30 pKa = 11.05KK31 pKa = 8.3MNLYY35 pKa = 9.6IIKK38 pKa = 10.36KK39 pKa = 8.87IFFYY43 pKa = 9.63VQRR46 pKa = 11.84II47 pKa = 3.54
Molecular weight: 5.83 kDa
Isoelectric point according different methods:
Peptides (in silico digests for buttom-up proteomics)
Below you can find in silico digests of the whole proteome with Trypsin, Chymotrypsin, Trypsin+LysC, LysN, ArgC proteases suitable for different mass spec machines.| Try ESI |
 |
|---|
| ChTry ESI |
|
|---|
| ArgC ESI |
|
|---|
| LysN ESI |
|
|---|
| TryLysC ESI |
|
|---|
| Try MALDI |
|
|---|
| ChTry MALDI |
|
|---|
| ArgC MALDI |
|
|---|
| LysN MALDI |
|
|---|
| TryLysC MALDI |
|
|---|
| Try LTQ |
|
|---|
| ChTry LTQ |
|
|---|
| ArgC LTQ |
|
|---|
| LysN LTQ |
|
|---|
| TryLysC LTQ |
|
|---|
| Try MSlow |
|
|---|
| ChTry MSlow |
|
|---|
| ArgC MSlow |
|
|---|
| LysN MSlow |
|
|---|
| TryLysC MSlow |
|
|---|
| Try MShigh |
|
|---|
| ChTry MShigh |
|
|---|
| ArgC MShigh |
|
|---|
| LysN MShigh |
|
|---|
| TryLysC MShigh |
|
|---|
General Statistics
Number of major isoforms |
Number of additional isoforms |
Number of all proteins |
Number of amino acids |
Min. Seq. Length |
Max. Seq. Length |
Avg. Seq. Length |
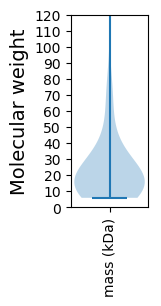
Avg. Mol. Weight |
|---|---|---|---|---|---|---|---|
0 |
14035 |
47 |
1419 |
230.1 |
26.45 |
Amino acid frequency
Ala |
Cys |
Asp |
Glu |
Phe |
Gly |
His |
Ile |
Lys |
Leu |
|---|---|---|---|---|---|---|---|---|---|
5.593 ± 0.503 | 0.834 ± 0.13 |
5.479 ± 0.192 | 7.346 ± 0.209 |
5.116 ± 0.259 | 5.023 ± 0.264 |
1.589 ± 0.159 | 8.593 ± 0.3 |
9.576 ± 0.327 | 8.963 ± 0.268 |
Met |
Asn |
Gln |
Pro |
Arg |
Ser |
Thr |
Val |
Trp |
Tyr |
|---|---|---|---|---|---|---|---|---|---|
2.33 ± 0.145 | 6.819 ± 0.296 |
2.793 ± 0.167 | 3.855 ± 0.169 |
3.769 ± 0.215 | 6.37 ± 0.261 |
5.23 ± 0.264 | 5.365 ± 0.169 |
1.197 ± 0.115 | 4.161 ± 0.278 |
Most of the basic statistics you can see at this page can be downloaded from this CSV file
See this proteome in:

Proteome-pI is available under Creative Commons Attribution-NoDerivs license, for more details see here
| Reference: Kozlowski LP. Proteome-pI 2.0: Proteome Isoelectric Point Database Update. Nucleic Acids Res. 2021, doi: 10.1093/nar/gkab944 | Contact: Lukasz P. Kozlowski |