Marinisporobacter balticus
Taxonomy: cellular organisms; Bacteria; Terrabacteria group; Firmicutes; Clostridia; Eubacteriales; Clostridiaceae; Marinisporobacter
Average proteome isoelectric point is 6.69
Get precalculated fractions of proteins

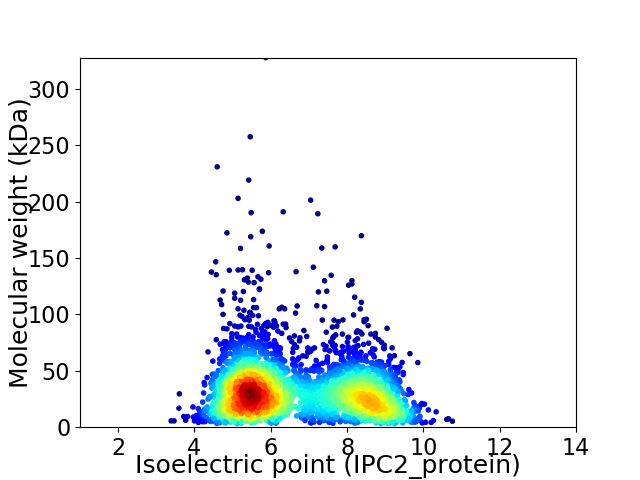
Virtual 2D-PAGE plot for 3681 proteins (isoelectric point calculated using IPC2_protein)
Get csv file with sequences according to given criteria:
* You can choose from 21 different methods for calculating isoelectric point
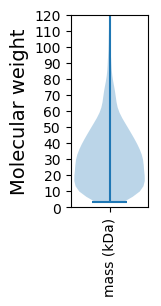
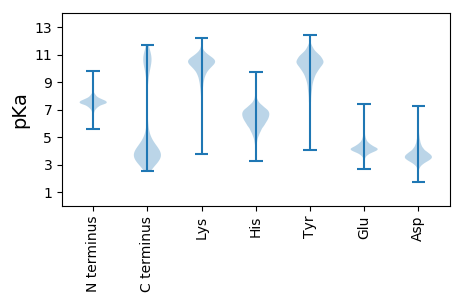
Summary statistics related to proteome-wise predictions


Protein with the lowest isoelectric point:
>tr|A0A4R2KKW2|A0A4R2KKW2_9CLOT Septal ring factor EnvC (AmiA/AmiB activator) OS=Marinisporobacter balticus OX=2018667 GN=EV214_11629 PE=4 SV=1
MM1 pKa = 7.78PNNIVFNNVARR12 pKa = 11.84QLKK15 pKa = 8.26TEE17 pKa = 3.96IYY19 pKa = 10.22GNDD22 pKa = 3.35GTTTRR27 pKa = 11.84VVAVDD32 pKa = 3.45SSGKK36 pKa = 9.83ILIGNLDD43 pKa = 4.13TINTISYY50 pKa = 9.14IATVDD55 pKa = 3.42TVNYY59 pKa = 8.53VAAVDD64 pKa = 3.87TVDD67 pKa = 3.46YY68 pKa = 10.42VAAVDD73 pKa = 4.17TVDD76 pKa = 3.63EE77 pKa = 4.42VANVSSVDD85 pKa = 3.62TVDD88 pKa = 3.49EE89 pKa = 4.37VVNVSSVDD97 pKa = 3.58TVDD100 pKa = 3.49EE101 pKa = 4.37VVNVSSVDD109 pKa = 3.58TVDD112 pKa = 3.49EE113 pKa = 4.37VVNVSSVDD121 pKa = 3.46TVDD124 pKa = 3.33YY125 pKa = 10.56VAAVDD130 pKa = 4.17TVDD133 pKa = 3.63EE134 pKa = 4.42VANVSSVDD142 pKa = 3.67TVDD145 pKa = 3.73EE146 pKa = 4.31VANVSSVDD154 pKa = 3.41TVDD157 pKa = 3.78YY158 pKa = 10.04VASVHH163 pKa = 5.36TVTHH167 pKa = 5.1VTDD170 pKa = 3.6TVDD173 pKa = 3.5VKK175 pKa = 10.78IVSNDD180 pKa = 3.31YY181 pKa = 9.51TEE183 pKa = 4.45SSSVVVLAGDD193 pKa = 3.93ASAAVLSMDD202 pKa = 3.24TSEE205 pKa = 4.73KK206 pKa = 11.05NMYY209 pKa = 9.73SYY211 pKa = 11.51YY212 pKa = 9.92IASSGAATVIVQISPTTTNSYY233 pKa = 10.77FIDD236 pKa = 4.58DD237 pKa = 3.72ATSAVMTANSTTVLVPEE254 pKa = 4.96RR255 pKa = 11.84FLKK258 pKa = 8.91YY259 pKa = 8.89TRR261 pKa = 11.84LYY263 pKa = 9.16LTAGSGGATASVYY276 pKa = 10.82YY277 pKa = 10.29NSHH280 pKa = 5.19NN281 pKa = 3.45
MM1 pKa = 7.78PNNIVFNNVARR12 pKa = 11.84QLKK15 pKa = 8.26TEE17 pKa = 3.96IYY19 pKa = 10.22GNDD22 pKa = 3.35GTTTRR27 pKa = 11.84VVAVDD32 pKa = 3.45SSGKK36 pKa = 9.83ILIGNLDD43 pKa = 4.13TINTISYY50 pKa = 9.14IATVDD55 pKa = 3.42TVNYY59 pKa = 8.53VAAVDD64 pKa = 3.87TVDD67 pKa = 3.46YY68 pKa = 10.42VAAVDD73 pKa = 4.17TVDD76 pKa = 3.63EE77 pKa = 4.42VANVSSVDD85 pKa = 3.62TVDD88 pKa = 3.49EE89 pKa = 4.37VVNVSSVDD97 pKa = 3.58TVDD100 pKa = 3.49EE101 pKa = 4.37VVNVSSVDD109 pKa = 3.58TVDD112 pKa = 3.49EE113 pKa = 4.37VVNVSSVDD121 pKa = 3.46TVDD124 pKa = 3.33YY125 pKa = 10.56VAAVDD130 pKa = 4.17TVDD133 pKa = 3.63EE134 pKa = 4.42VANVSSVDD142 pKa = 3.67TVDD145 pKa = 3.73EE146 pKa = 4.31VANVSSVDD154 pKa = 3.41TVDD157 pKa = 3.78YY158 pKa = 10.04VASVHH163 pKa = 5.36TVTHH167 pKa = 5.1VTDD170 pKa = 3.6TVDD173 pKa = 3.5VKK175 pKa = 10.78IVSNDD180 pKa = 3.31YY181 pKa = 9.51TEE183 pKa = 4.45SSSVVVLAGDD193 pKa = 3.93ASAAVLSMDD202 pKa = 3.24TSEE205 pKa = 4.73KK206 pKa = 11.05NMYY209 pKa = 9.73SYY211 pKa = 11.51YY212 pKa = 9.92IASSGAATVIVQISPTTTNSYY233 pKa = 10.77FIDD236 pKa = 4.58DD237 pKa = 3.72ATSAVMTANSTTVLVPEE254 pKa = 4.96RR255 pKa = 11.84FLKK258 pKa = 8.91YY259 pKa = 8.89TRR261 pKa = 11.84LYY263 pKa = 9.16LTAGSGGATASVYY276 pKa = 10.82YY277 pKa = 10.29NSHH280 pKa = 5.19NN281 pKa = 3.45
Molecular weight: 29.56 kDa
Isoelectric point according different methods:
Protein with the highest isoelectric point:
>tr|A0A4R2KR54|A0A4R2KR54_9CLOT Dihydrolipoyl dehydrogenase OS=Marinisporobacter balticus OX=2018667 GN=EV214_10957 PE=3 SV=1
MM1 pKa = 7.61AKK3 pKa = 10.14KK4 pKa = 10.1SLKK7 pKa = 9.8VKK9 pKa = 10.03QSRR12 pKa = 11.84TQKK15 pKa = 10.4YY16 pKa = 6.9STRR19 pKa = 11.84EE20 pKa = 3.73YY21 pKa = 10.59NRR23 pKa = 11.84CRR25 pKa = 11.84ICGRR29 pKa = 11.84PHH31 pKa = 6.75AYY33 pKa = 9.43LRR35 pKa = 11.84KK36 pKa = 9.69FGICRR41 pKa = 11.84ICFRR45 pKa = 11.84EE46 pKa = 3.81LAYY49 pKa = 10.0KK50 pKa = 10.86GEE52 pKa = 4.16IPGVRR57 pKa = 11.84KK58 pKa = 10.13ASWW61 pKa = 2.78
MM1 pKa = 7.61AKK3 pKa = 10.14KK4 pKa = 10.1SLKK7 pKa = 9.8VKK9 pKa = 10.03QSRR12 pKa = 11.84TQKK15 pKa = 10.4YY16 pKa = 6.9STRR19 pKa = 11.84EE20 pKa = 3.73YY21 pKa = 10.59NRR23 pKa = 11.84CRR25 pKa = 11.84ICGRR29 pKa = 11.84PHH31 pKa = 6.75AYY33 pKa = 9.43LRR35 pKa = 11.84KK36 pKa = 9.69FGICRR41 pKa = 11.84ICFRR45 pKa = 11.84EE46 pKa = 3.81LAYY49 pKa = 10.0KK50 pKa = 10.86GEE52 pKa = 4.16IPGVRR57 pKa = 11.84KK58 pKa = 10.13ASWW61 pKa = 2.78
Molecular weight: 7.27 kDa
Isoelectric point according different methods:
Peptides (in silico digests for buttom-up proteomics)
Below you can find in silico digests of the whole proteome with Trypsin, Chymotrypsin, Trypsin+LysC, LysN, ArgC proteases suitable for different mass spec machines.| Try ESI |
 |
|---|
| ChTry ESI |
 |
|---|
| ArgC ESI |
 |
|---|
| LysN ESI |
 |
|---|
| TryLysC ESI |
 |
|---|
| Try MALDI |
 |
|---|
| ChTry MALDI |
 |
|---|
| ArgC MALDI |
 |
|---|
| LysN MALDI |
 |
|---|
| TryLysC MALDI |
 |
|---|
| Try LTQ |
 |
|---|
| ChTry LTQ |
 |
|---|
| ArgC LTQ |
 |
|---|
| LysN LTQ |
 |
|---|
| TryLysC LTQ |
 |
|---|
| Try MSlow |
 |
|---|
| ChTry MSlow |
 |
|---|
| ArgC MSlow |
 |
|---|
| LysN MSlow |
 |
|---|
| TryLysC MSlow |
 |
|---|
| Try MShigh |
 |
|---|
| ChTry MShigh |
 |
|---|
| ArgC MShigh |
 |
|---|
| LysN MShigh |
 |
|---|
| TryLysC MShigh |
 |
|---|
General Statistics
Number of major isoforms |
Number of additional isoforms |
Number of all proteins |
Number of amino acids |
Min. Seq. Length |
Max. Seq. Length |
Avg. Seq. Length |
Avg. Mol. Weight |
|---|---|---|---|---|---|---|---|
0 |
1099301 |
26 |
2848 |
298.6 |
33.72 |
Amino acid frequency
Ala |
Cys |
Asp |
Glu |
Phe |
Gly |
His |
Ile |
Lys |
Leu |
|---|---|---|---|---|---|---|---|---|---|
6.084 ± 0.043 | 1.121 ± 0.019 |
5.376 ± 0.032 | 7.545 ± 0.049 |
4.263 ± 0.035 | 6.634 ± 0.047 |
1.756 ± 0.019 | 9.835 ± 0.057 |
9.031 ± 0.043 | 8.865 ± 0.043 |
Met |
Asn |
Gln |
Pro |
Arg |
Ser |
Thr |
Val |
Trp |
Tyr |
|---|---|---|---|---|---|---|---|---|---|
3.022 ± 0.022 | 5.424 ± 0.037 |
2.979 ± 0.023 | 2.865 ± 0.024 |
3.559 ± 0.027 | 5.511 ± 0.033 |
5.002 ± 0.03 | 6.568 ± 0.038 |
0.724 ± 0.014 | 3.837 ± 0.029 |
Most of the basic statistics you can see at this page can be downloaded from this CSV file
Proteome-pI is available under Creative Commons Attribution-NoDerivs license, for more details see here
| Reference: Kozlowski LP. Proteome-pI 2.0: Proteome Isoelectric Point Database Update. Nucleic Acids Res. 2021, doi: 10.1093/nar/gkab944 | Contact: Lukasz P. Kozlowski |
