Neocallimastix californiae
Taxonomy: cellular organisms; Eukaryota; Opisthokonta; Fungi; Fungi incertae sedis; Chytridiomycota; Chytridiomycota incertae sedis; Neocallimastigomycetes; Neocallimastigales; Neocallimastigaceae; Neocallimastix
Average proteome isoelectric point is 6.56
Get precalculated fractions of proteins

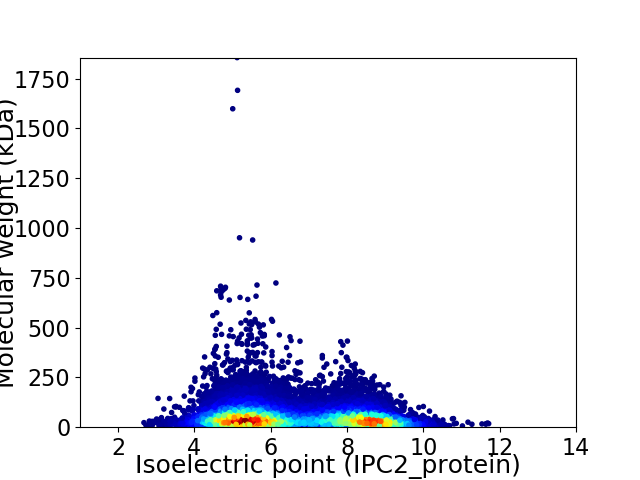
Virtual 2D-PAGE plot for 19964 proteins (isoelectric point calculated using IPC2_protein)
Get csv file with sequences according to given criteria:
* You can choose from 21 different methods for calculating isoelectric point
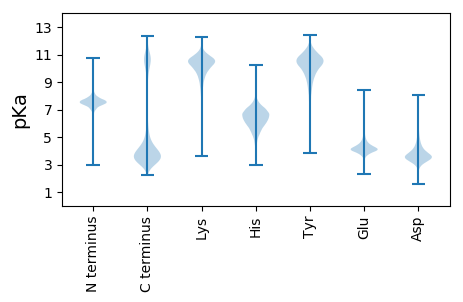
Summary statistics related to proteome-wise predictions


Protein with the lowest isoelectric point:
>tr|A0A1Y2FKW6|A0A1Y2FKW6_9FUNG Uncharacterized protein OS=Neocallimastix californiae OX=1754190 GN=LY90DRAFT_663591 PE=4 SV=1
MM1 pKa = 7.41KK2 pKa = 10.18FSLVFGIVSAFVIVTNAYY20 pKa = 7.83PIPCFPGEE28 pKa = 3.87FGGNKK33 pKa = 9.24GKK35 pKa = 9.31PAPPFGGWPGAGNKK49 pKa = 10.09GNGGWPAPPNGGWPGNGDD67 pKa = 3.4KK68 pKa = 11.38GKK70 pKa = 10.89GGWPNNPWDD79 pKa = 4.37NKK81 pKa = 10.98NKK83 pKa = 9.83GDD85 pKa = 4.56KK86 pKa = 11.02NKK88 pKa = 10.45GDD90 pKa = 3.72KK91 pKa = 11.07NKK93 pKa = 10.45GDD95 pKa = 3.72KK96 pKa = 11.07NKK98 pKa = 10.45GDD100 pKa = 3.75KK101 pKa = 10.99NKK103 pKa = 10.65GDD105 pKa = 3.93GKK107 pKa = 11.07GEE109 pKa = 4.13EE110 pKa = 4.85CGPTSPNGPCKK121 pKa = 10.31PEE123 pKa = 4.23TPPSPPTIPLPPSPPSPPSPPSPPSPPSPPNGNNDD158 pKa = 3.03KK159 pKa = 11.52GEE161 pKa = 4.14AEE163 pKa = 4.15EE164 pKa = 5.27CGPDD168 pKa = 3.94SPNGPCEE175 pKa = 4.26PDD177 pKa = 3.6TPSTPPTPPSPPNGDD192 pKa = 3.31NDD194 pKa = 3.7TGEE197 pKa = 4.61AEE199 pKa = 4.26EE200 pKa = 5.28CGPDD204 pKa = 3.94SPNGPCEE211 pKa = 4.17PDD213 pKa = 3.67TPPSPPSLPSLPNGDD228 pKa = 3.63NDD230 pKa = 3.2IGEE233 pKa = 4.56AEE235 pKa = 4.22EE236 pKa = 5.14CGPDD240 pKa = 3.79SPKK243 pKa = 10.73GPCEE247 pKa = 4.09PEE249 pKa = 4.32SPPTPPNSPCDD260 pKa = 3.64PTTDD264 pKa = 3.9PSCAPEE270 pKa = 4.19PLCDD274 pKa = 3.63PTTDD278 pKa = 3.92PSCAPEE284 pKa = 4.47PPCDD288 pKa = 3.65PTTDD292 pKa = 3.9PSCAPEE298 pKa = 4.47PPCDD302 pKa = 3.65PTTDD306 pKa = 3.9PSCAPEE312 pKa = 4.47PPCDD316 pKa = 3.65PTTDD320 pKa = 3.9PSCAPEE326 pKa = 4.24PSCDD330 pKa = 3.53PSSDD334 pKa = 4.01PNCGNSDD341 pKa = 4.02PNEE344 pKa = 4.42DD345 pKa = 4.09PADD348 pKa = 4.0LLQVSEE354 pKa = 5.18DD355 pKa = 3.76EE356 pKa = 4.74NIGNEE361 pKa = 4.5DD362 pKa = 3.34IEE364 pKa = 4.54EE365 pKa = 4.29VNDD368 pKa = 3.78SNDD371 pKa = 2.99IVDD374 pKa = 3.94IANSSDD380 pKa = 3.41VEE382 pKa = 4.18
MM1 pKa = 7.41KK2 pKa = 10.18FSLVFGIVSAFVIVTNAYY20 pKa = 7.83PIPCFPGEE28 pKa = 3.87FGGNKK33 pKa = 9.24GKK35 pKa = 9.31PAPPFGGWPGAGNKK49 pKa = 10.09GNGGWPAPPNGGWPGNGDD67 pKa = 3.4KK68 pKa = 11.38GKK70 pKa = 10.89GGWPNNPWDD79 pKa = 4.37NKK81 pKa = 10.98NKK83 pKa = 9.83GDD85 pKa = 4.56KK86 pKa = 11.02NKK88 pKa = 10.45GDD90 pKa = 3.72KK91 pKa = 11.07NKK93 pKa = 10.45GDD95 pKa = 3.72KK96 pKa = 11.07NKK98 pKa = 10.45GDD100 pKa = 3.75KK101 pKa = 10.99NKK103 pKa = 10.65GDD105 pKa = 3.93GKK107 pKa = 11.07GEE109 pKa = 4.13EE110 pKa = 4.85CGPTSPNGPCKK121 pKa = 10.31PEE123 pKa = 4.23TPPSPPTIPLPPSPPSPPSPPSPPSPPSPPNGNNDD158 pKa = 3.03KK159 pKa = 11.52GEE161 pKa = 4.14AEE163 pKa = 4.15EE164 pKa = 5.27CGPDD168 pKa = 3.94SPNGPCEE175 pKa = 4.26PDD177 pKa = 3.6TPSTPPTPPSPPNGDD192 pKa = 3.31NDD194 pKa = 3.7TGEE197 pKa = 4.61AEE199 pKa = 4.26EE200 pKa = 5.28CGPDD204 pKa = 3.94SPNGPCEE211 pKa = 4.17PDD213 pKa = 3.67TPPSPPSLPSLPNGDD228 pKa = 3.63NDD230 pKa = 3.2IGEE233 pKa = 4.56AEE235 pKa = 4.22EE236 pKa = 5.14CGPDD240 pKa = 3.79SPKK243 pKa = 10.73GPCEE247 pKa = 4.09PEE249 pKa = 4.32SPPTPPNSPCDD260 pKa = 3.64PTTDD264 pKa = 3.9PSCAPEE270 pKa = 4.19PLCDD274 pKa = 3.63PTTDD278 pKa = 3.92PSCAPEE284 pKa = 4.47PPCDD288 pKa = 3.65PTTDD292 pKa = 3.9PSCAPEE298 pKa = 4.47PPCDD302 pKa = 3.65PTTDD306 pKa = 3.9PSCAPEE312 pKa = 4.47PPCDD316 pKa = 3.65PTTDD320 pKa = 3.9PSCAPEE326 pKa = 4.24PSCDD330 pKa = 3.53PSSDD334 pKa = 4.01PNCGNSDD341 pKa = 4.02PNEE344 pKa = 4.42DD345 pKa = 4.09PADD348 pKa = 4.0LLQVSEE354 pKa = 5.18DD355 pKa = 3.76EE356 pKa = 4.74NIGNEE361 pKa = 4.5DD362 pKa = 3.34IEE364 pKa = 4.54EE365 pKa = 4.29VNDD368 pKa = 3.78SNDD371 pKa = 2.99IVDD374 pKa = 3.94IANSSDD380 pKa = 3.41VEE382 pKa = 4.18
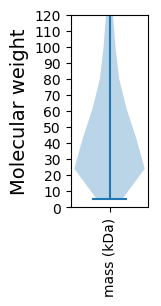
Molecular weight: 38.86 kDa
Isoelectric point according different methods:
Protein with the highest isoelectric point:
>tr|A0A1Y2C741|A0A1Y2C741_9FUNG Brix-domain-containing protein OS=Neocallimastix californiae OX=1754190 GN=LY90DRAFT_458330 PE=4 SV=1
LL1 pKa = 7.19FRR3 pKa = 11.84INILFRR9 pKa = 11.84INILFRR15 pKa = 11.84INILFRR21 pKa = 11.84INILFRR27 pKa = 11.84INILFRR33 pKa = 11.84INILFRR39 pKa = 11.84INILFRR45 pKa = 11.84INILFRR51 pKa = 11.84INILFRR57 pKa = 11.84INILFRR63 pKa = 11.84INILFRR69 pKa = 11.84INILFRR75 pKa = 11.84INILFRR81 pKa = 11.84INILFRR87 pKa = 11.84INILFRR93 pKa = 11.84INILFRR99 pKa = 11.84INILFRR105 pKa = 11.84INILFRR111 pKa = 11.84INILFRR117 pKa = 11.84INILFRR123 pKa = 11.84INILFKK129 pKa = 10.82KK130 pKa = 10.35
LL1 pKa = 7.19FRR3 pKa = 11.84INILFRR9 pKa = 11.84INILFRR15 pKa = 11.84INILFRR21 pKa = 11.84INILFRR27 pKa = 11.84INILFRR33 pKa = 11.84INILFRR39 pKa = 11.84INILFRR45 pKa = 11.84INILFRR51 pKa = 11.84INILFRR57 pKa = 11.84INILFRR63 pKa = 11.84INILFRR69 pKa = 11.84INILFRR75 pKa = 11.84INILFRR81 pKa = 11.84INILFRR87 pKa = 11.84INILFRR93 pKa = 11.84INILFRR99 pKa = 11.84INILFRR105 pKa = 11.84INILFRR111 pKa = 11.84INILFRR117 pKa = 11.84INILFRR123 pKa = 11.84INILFKK129 pKa = 10.82KK130 pKa = 10.35
Molecular weight: 16.43 kDa
Isoelectric point according different methods:
Peptides (in silico digests for buttom-up proteomics)
Below you can find in silico digests of the whole proteome with Trypsin, Chymotrypsin, Trypsin+LysC, LysN, ArgC proteases suitable for different mass spec machines.| Try ESI |
 |
|---|
| ChTry ESI |
 |
|---|
| ArgC ESI |
 |
|---|
| LysN ESI |
 |
|---|
| TryLysC ESI |
 |
|---|
| Try MALDI |
 |
|---|
| ChTry MALDI |
 |
|---|
| ArgC MALDI |
 |
|---|
| LysN MALDI |
 |
|---|
| TryLysC MALDI |
 |
|---|
| Try LTQ |
 |
|---|
| ChTry LTQ |
 |
|---|
| ArgC LTQ |
 |
|---|
| LysN LTQ |
 |
|---|
| TryLysC LTQ |
 |
|---|
| Try MSlow |
 |
|---|
| ChTry MSlow |
 |
|---|
| ArgC MSlow |
 |
|---|
| LysN MSlow |
 |
|---|
| TryLysC MSlow |
 |
|---|
| Try MShigh |
 |
|---|
| ChTry MShigh |
 |
|---|
| ArgC MShigh |
 |
|---|
| LysN MShigh |
 |
|---|
| TryLysC MShigh |
 |
|---|
General Statistics
Number of major isoforms |
Number of additional isoforms |
Number of all proteins |
Number of amino acids |
Min. Seq. Length |
Max. Seq. Length |
Avg. Seq. Length |
Avg. Mol. Weight |
|---|---|---|---|---|---|---|---|
9707863 |
49 |
15892 |
486.3 |
55.75 |
Amino acid frequency
Ala |
Cys |
Asp |
Glu |
Phe |
Gly |
His |
Ile |
Lys |
Leu |
|---|---|---|---|---|---|---|---|---|---|
3.757 ± 0.018 | 1.509 ± 0.013 |
5.716 ± 0.014 | 7.348 ± 0.024 |
4.271 ± 0.014 | 4.262 ± 0.021 |
1.65 ± 0.008 | 8.706 ± 0.025 |
8.972 ± 0.02 | 8.091 ± 0.022 |
Met |
Asn |
Gln |
Pro |
Arg |
Ser |
Thr |
Val |
Trp |
Tyr |
|---|---|---|---|---|---|---|---|---|---|
1.983 ± 0.008 | 9.958 ± 0.044 |
3.465 ± 0.015 | 3.242 ± 0.018 |
3.203 ± 0.014 | 8.52 ± 0.026 |
5.435 ± 0.018 | 4.567 ± 0.016 |
0.788 ± 0.007 | 4.557 ± 0.019 |
Most of the basic statistics you can see at this page can be downloaded from this CSV file
Proteome-pI is available under Creative Commons Attribution-NoDerivs license, for more details see here
| Reference: Kozlowski LP. Proteome-pI 2.0: Proteome Isoelectric Point Database Update. Nucleic Acids Res. 2021, doi: 10.1093/nar/gkab944 | Contact: Lukasz P. Kozlowski |
