Cotton leaf curl Kokhran virus
Taxonomy: Viruses; Monodnaviria; Shotokuvirae; Cressdnaviricota; Repensiviricetes; Geplafuvirales; Geminiviridae; Begomovirus
Average proteome isoelectric point is 7.91
Get precalculated fractions of proteins

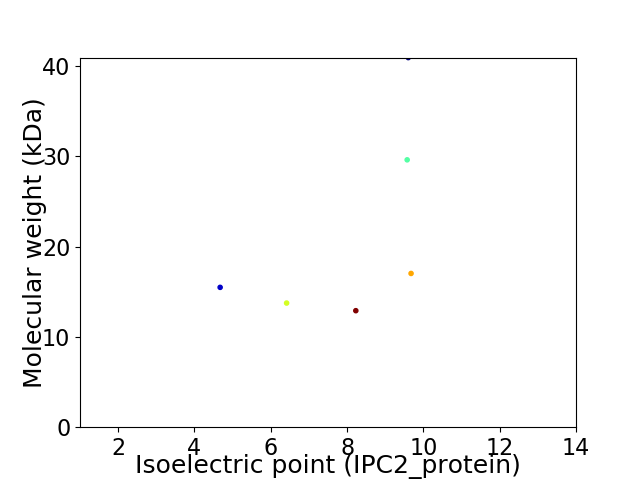
Virtual 2D-PAGE plot for 6 proteins (isoelectric point calculated using IPC2_protein)
Get csv file with sequences according to given criteria:
* You can choose from 21 different methods for calculating isoelectric point
Summary statistics related to proteome-wise predictions


Protein with the lowest isoelectric point:
>tr|D3Y1N4|D3Y1N4_9GEMI Replication enhancer protein OS=Cotton leaf curl Kokhran virus OX=222464 GN=AC2 PE=3 SV=1
MM1 pKa = 8.25DD2 pKa = 3.98SRR4 pKa = 11.84TRR6 pKa = 11.84EE7 pKa = 4.33PITLQPCRR15 pKa = 11.84MSHH18 pKa = 5.35NLEE21 pKa = 3.84VPIPLFQNHH30 pKa = 5.62QPRR33 pKa = 11.84QPSIHH38 pKa = 7.24DD39 pKa = 3.67EE40 pKa = 3.82YY41 pKa = 11.2GYY43 pKa = 8.04THH45 pKa = 7.19DD46 pKa = 4.15QDD48 pKa = 4.47PVQSQPEE55 pKa = 4.17EE56 pKa = 4.43SVGDD60 pKa = 3.51TQMFHH65 pKa = 7.1SFPNLDD71 pKa = 4.87DD72 pKa = 3.97LTASDD77 pKa = 3.38WSFLKK82 pKa = 10.82GLYY85 pKa = 10.01DD86 pKa = 3.72SSASIFNLLRR96 pKa = 11.84NCQYY100 pKa = 11.44YY101 pKa = 10.23IMCLSSWSCIMEE113 pKa = 5.02CITEE117 pKa = 4.09HH118 pKa = 5.74VVYY121 pKa = 10.52VDD123 pKa = 3.35QSSSIKK129 pKa = 10.4FNIYY133 pKa = 10.21
MM1 pKa = 8.25DD2 pKa = 3.98SRR4 pKa = 11.84TRR6 pKa = 11.84EE7 pKa = 4.33PITLQPCRR15 pKa = 11.84MSHH18 pKa = 5.35NLEE21 pKa = 3.84VPIPLFQNHH30 pKa = 5.62QPRR33 pKa = 11.84QPSIHH38 pKa = 7.24DD39 pKa = 3.67EE40 pKa = 3.82YY41 pKa = 11.2GYY43 pKa = 8.04THH45 pKa = 7.19DD46 pKa = 4.15QDD48 pKa = 4.47PVQSQPEE55 pKa = 4.17EE56 pKa = 4.43SVGDD60 pKa = 3.51TQMFHH65 pKa = 7.1SFPNLDD71 pKa = 4.87DD72 pKa = 3.97LTASDD77 pKa = 3.38WSFLKK82 pKa = 10.82GLYY85 pKa = 10.01DD86 pKa = 3.72SSASIFNLLRR96 pKa = 11.84NCQYY100 pKa = 11.44YY101 pKa = 10.23IMCLSSWSCIMEE113 pKa = 5.02CITEE117 pKa = 4.09HH118 pKa = 5.74VVYY121 pKa = 10.52VDD123 pKa = 3.35QSSSIKK129 pKa = 10.4FNIYY133 pKa = 10.21
Molecular weight: 15.49 kDa
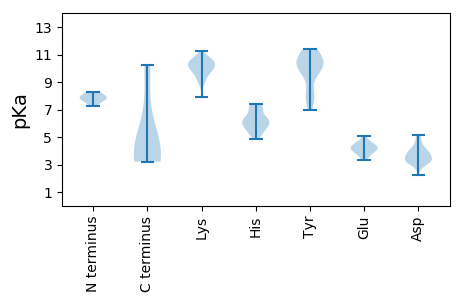
Isoelectric point according different methods:
Protein with the highest isoelectric point:
>tr|D3Y1N5|D3Y1N5_9GEMI Rep protein OS=Cotton leaf curl Kokhran virus OX=222464 GN=AC1 PE=3 SV=1
MM1 pKa = 7.79RR2 pKa = 11.84SSSLSKK8 pKa = 10.39DD9 pKa = 2.76HH10 pKa = 6.52CTQLSIKK17 pKa = 8.75VQHH20 pKa = 6.48RR21 pKa = 11.84EE22 pKa = 3.8ARR24 pKa = 11.84DD25 pKa = 3.46ATGEE29 pKa = 4.24RR30 pKa = 11.84IRR32 pKa = 11.84SCSPCYY38 pKa = 9.88SSSVITATPWIHH50 pKa = 6.43AQGNPSLCSLAGCRR64 pKa = 11.84IIWRR68 pKa = 11.84FPSLYY73 pKa = 10.06FRR75 pKa = 11.84IISHH79 pKa = 5.6VNRR82 pKa = 11.84PFTTNMDD89 pKa = 3.21ILTIRR94 pKa = 11.84IQFNHH99 pKa = 6.33NLRR102 pKa = 11.84KK103 pKa = 9.8ALGIHH108 pKa = 6.03KK109 pKa = 9.67CFIAFRR115 pKa = 11.84IWMTSQPPTGRR126 pKa = 11.84FLRR129 pKa = 11.84VFTTQVLQYY138 pKa = 10.18LIYY141 pKa = 10.43LGIVSIII148 pKa = 3.43
MM1 pKa = 7.79RR2 pKa = 11.84SSSLSKK8 pKa = 10.39DD9 pKa = 2.76HH10 pKa = 6.52CTQLSIKK17 pKa = 8.75VQHH20 pKa = 6.48RR21 pKa = 11.84EE22 pKa = 3.8ARR24 pKa = 11.84DD25 pKa = 3.46ATGEE29 pKa = 4.24RR30 pKa = 11.84IRR32 pKa = 11.84SCSPCYY38 pKa = 9.88SSSVITATPWIHH50 pKa = 6.43AQGNPSLCSLAGCRR64 pKa = 11.84IIWRR68 pKa = 11.84FPSLYY73 pKa = 10.06FRR75 pKa = 11.84IISHH79 pKa = 5.6VNRR82 pKa = 11.84PFTTNMDD89 pKa = 3.21ILTIRR94 pKa = 11.84IQFNHH99 pKa = 6.33NLRR102 pKa = 11.84KK103 pKa = 9.8ALGIHH108 pKa = 6.03KK109 pKa = 9.67CFIAFRR115 pKa = 11.84IWMTSQPPTGRR126 pKa = 11.84FLRR129 pKa = 11.84VFTTQVLQYY138 pKa = 10.18LIYY141 pKa = 10.43LGIVSIII148 pKa = 3.43
Molecular weight: 17.03 kDa
Isoelectric point according different methods:
Peptides (in silico digests for buttom-up proteomics)
Below you can find in silico digests of the whole proteome with Trypsin, Chymotrypsin, Trypsin+LysC, LysN, ArgC proteases suitable for different mass spec machines.| Try ESI |
 |
|---|
| ChTry ESI |
 |
|---|
| ArgC ESI |
 |
|---|
| LysN ESI |
 |
|---|
| TryLysC ESI |
 |
|---|
| Try MALDI |
 |
|---|
| ChTry MALDI |
 |
|---|
| ArgC MALDI |
 |
|---|
| LysN MALDI |
 |
|---|
| TryLysC MALDI |
 |
|---|
| Try LTQ |
 |
|---|
| ChTry LTQ |
 |
|---|
| ArgC LTQ |
 |
|---|
| LysN LTQ |
 |
|---|
| TryLysC LTQ |
 |
|---|
| Try MSlow |
 |
|---|
| ChTry MSlow |
 |
|---|
| ArgC MSlow |
 |
|---|
| LysN MSlow |
 |
|---|
| TryLysC MSlow |
 |
|---|
| Try MShigh |
 |
|---|
| ChTry MShigh |
 |
|---|
| ArgC MShigh |
 |
|---|
| LysN MShigh |
 |
|---|
| TryLysC MShigh |
 |
|---|
General Statistics
Number of major isoforms |
Number of additional isoforms |
Number of all proteins |
Number of amino acids |
Min. Seq. Length |
Max. Seq. Length |
Avg. Seq. Length |
Avg. Mol. Weight |
|---|---|---|---|---|---|---|---|
0 |
1125 |
112 |
358 |
187.5 |
21.62 |
Amino acid frequency
Ala |
Cys |
Asp |
Glu |
Phe |
Gly |
His |
Ile |
Lys |
Leu |
|---|---|---|---|---|---|---|---|---|---|
4.533 ± 0.691 | 3.2 ± 0.505 |
4.356 ± 0.557 | 3.556 ± 0.53 |
4.8 ± 0.599 | 4.444 ± 0.575 |
3.733 ± 0.349 | 5.689 ± 0.977 |
5.244 ± 1.132 | 6.578 ± 0.844 |
Met |
Asn |
Gln |
Pro |
Arg |
Ser |
Thr |
Val |
Trp |
Tyr |
|---|---|---|---|---|---|---|---|---|---|
2.4 ± 0.494 | 4.533 ± 0.475 |
5.156 ± 0.423 | 5.333 ± 0.84 |
8.622 ± 0.86 | 11.378 ± 1.31 |
5.778 ± 0.571 | 5.244 ± 1.396 |
1.422 ± 0.116 | 4.0 ± 0.546 |
Most of the basic statistics you can see at this page can be downloaded from this CSV file
Proteome-pI is available under Creative Commons Attribution-NoDerivs license, for more details see here
| Reference: Kozlowski LP. Proteome-pI 2.0: Proteome Isoelectric Point Database Update. Nucleic Acids Res. 2021, doi: 10.1093/nar/gkab944 | Contact: Lukasz P. Kozlowski |
