Glarea lozoyensis (strain ATCC 20868 / MF5171)
Taxonomy: cellular organisms; Eukaryota; Opisthokonta; Fungi; Dikarya; Ascomycota; saccharomyceta; Pezizomycotina; leotiomyceta; sordariomyceta; Leotiomycetes; Helotiales; Helotiaceae; Glarea; Glarea lozoyensis
Average proteome isoelectric point is 6.48
Get precalculated fractions of proteins

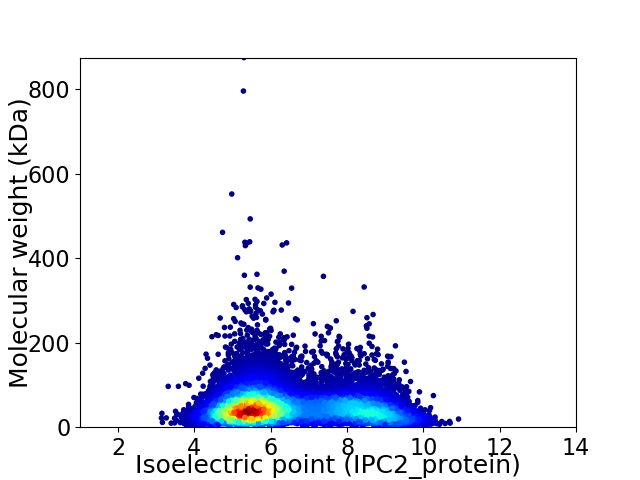
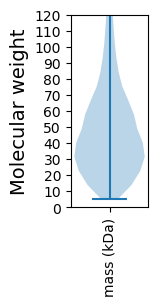
Virtual 2D-PAGE plot for 13082 proteins (isoelectric point calculated using IPC2_protein)
Get csv file with sequences according to given criteria:
* You can choose from 21 different methods for calculating isoelectric point
Summary statistics related to proteome-wise predictions


Protein with the lowest isoelectric point:
>tr|S3D3B8|S3D3B8_GLAL2 Acetyl-CoA synthetase-like protein OS=Glarea lozoyensis (strain ATCC 20868 / MF5171) OX=1116229 GN=GLAREA_02479 PE=4 SV=1
MM1 pKa = 7.42SLHH4 pKa = 6.57LRR6 pKa = 11.84DD7 pKa = 3.22IDD9 pKa = 4.05SPKK12 pKa = 9.98EE13 pKa = 3.73SHH15 pKa = 6.6PFISTRR21 pKa = 11.84HH22 pKa = 4.43SHH24 pKa = 6.11NDD26 pKa = 3.17YY27 pKa = 10.94DD28 pKa = 4.17IKK30 pKa = 9.98TSNMDD35 pKa = 3.2SSDD38 pKa = 3.13ITDD41 pKa = 3.98PNMDD45 pKa = 4.76DD46 pKa = 3.7SDD48 pKa = 4.58NDD50 pKa = 3.32ISDD53 pKa = 4.14TEE55 pKa = 4.29TSDD58 pKa = 3.91VDD60 pKa = 4.33SPDD63 pKa = 3.69NQSPNYY69 pKa = 9.68DD70 pKa = 3.82SPNTDD75 pKa = 4.53DD76 pKa = 5.77DD77 pKa = 6.14DD78 pKa = 6.81SDD80 pKa = 5.13FDD82 pKa = 5.84DD83 pKa = 4.12SDD85 pKa = 4.78FYY87 pKa = 11.61LSSDD91 pKa = 5.06DD92 pKa = 5.62SDD94 pKa = 6.24DD95 pKa = 5.86DD96 pKa = 5.91DD97 pKa = 5.71FDD99 pKa = 4.43PSNYY103 pKa = 9.93EE104 pKa = 3.93SATHH108 pKa = 5.38YY109 pKa = 10.9ARR111 pKa = 11.84IYY113 pKa = 8.57EE114 pKa = 4.12FCEE117 pKa = 4.18AEE119 pKa = 4.2GVDD122 pKa = 5.36IEE124 pKa = 5.09DD125 pKa = 3.79LDD127 pKa = 3.55GRR129 pKa = 11.84YY130 pKa = 10.22YY131 pKa = 10.21IVDD134 pKa = 3.54HH135 pKa = 6.72EE136 pKa = 5.28SNGLEE141 pKa = 4.11SDD143 pKa = 3.77GAEE146 pKa = 4.22PDD148 pKa = 3.21HH149 pKa = 6.45STTEE153 pKa = 4.25TFSTLAEE160 pKa = 3.65WAAAEE165 pKa = 4.2KK166 pKa = 10.69LAVLYY171 pKa = 10.29SYY173 pKa = 11.5SLIPGEE179 pKa = 4.04KK180 pKa = 9.64PIVKK184 pKa = 9.43WIFPVEE190 pKa = 4.02YY191 pKa = 9.59RR192 pKa = 11.84KK193 pKa = 7.97TPPPPTAIALFLTDD207 pKa = 5.33LKK209 pKa = 11.34YY210 pKa = 10.98LLSWYY215 pKa = 9.83FISHH219 pKa = 7.86LIQSLVIMLQFGGILVILYY238 pKa = 9.5IVVGCGVAVWKK249 pKa = 10.77LGVLTWSTVCNGVSILIKK267 pKa = 10.67GVGEE271 pKa = 4.08FVNN274 pKa = 4.15
MM1 pKa = 7.42SLHH4 pKa = 6.57LRR6 pKa = 11.84DD7 pKa = 3.22IDD9 pKa = 4.05SPKK12 pKa = 9.98EE13 pKa = 3.73SHH15 pKa = 6.6PFISTRR21 pKa = 11.84HH22 pKa = 4.43SHH24 pKa = 6.11NDD26 pKa = 3.17YY27 pKa = 10.94DD28 pKa = 4.17IKK30 pKa = 9.98TSNMDD35 pKa = 3.2SSDD38 pKa = 3.13ITDD41 pKa = 3.98PNMDD45 pKa = 4.76DD46 pKa = 3.7SDD48 pKa = 4.58NDD50 pKa = 3.32ISDD53 pKa = 4.14TEE55 pKa = 4.29TSDD58 pKa = 3.91VDD60 pKa = 4.33SPDD63 pKa = 3.69NQSPNYY69 pKa = 9.68DD70 pKa = 3.82SPNTDD75 pKa = 4.53DD76 pKa = 5.77DD77 pKa = 6.14DD78 pKa = 6.81SDD80 pKa = 5.13FDD82 pKa = 5.84DD83 pKa = 4.12SDD85 pKa = 4.78FYY87 pKa = 11.61LSSDD91 pKa = 5.06DD92 pKa = 5.62SDD94 pKa = 6.24DD95 pKa = 5.86DD96 pKa = 5.91DD97 pKa = 5.71FDD99 pKa = 4.43PSNYY103 pKa = 9.93EE104 pKa = 3.93SATHH108 pKa = 5.38YY109 pKa = 10.9ARR111 pKa = 11.84IYY113 pKa = 8.57EE114 pKa = 4.12FCEE117 pKa = 4.18AEE119 pKa = 4.2GVDD122 pKa = 5.36IEE124 pKa = 5.09DD125 pKa = 3.79LDD127 pKa = 3.55GRR129 pKa = 11.84YY130 pKa = 10.22YY131 pKa = 10.21IVDD134 pKa = 3.54HH135 pKa = 6.72EE136 pKa = 5.28SNGLEE141 pKa = 4.11SDD143 pKa = 3.77GAEE146 pKa = 4.22PDD148 pKa = 3.21HH149 pKa = 6.45STTEE153 pKa = 4.25TFSTLAEE160 pKa = 3.65WAAAEE165 pKa = 4.2KK166 pKa = 10.69LAVLYY171 pKa = 10.29SYY173 pKa = 11.5SLIPGEE179 pKa = 4.04KK180 pKa = 9.64PIVKK184 pKa = 9.43WIFPVEE190 pKa = 4.02YY191 pKa = 9.59RR192 pKa = 11.84KK193 pKa = 7.97TPPPPTAIALFLTDD207 pKa = 5.33LKK209 pKa = 11.34YY210 pKa = 10.98LLSWYY215 pKa = 9.83FISHH219 pKa = 7.86LIQSLVIMLQFGGILVILYY238 pKa = 9.5IVVGCGVAVWKK249 pKa = 10.77LGVLTWSTVCNGVSILIKK267 pKa = 10.67GVGEE271 pKa = 4.08FVNN274 pKa = 4.15
Molecular weight: 30.69 kDa
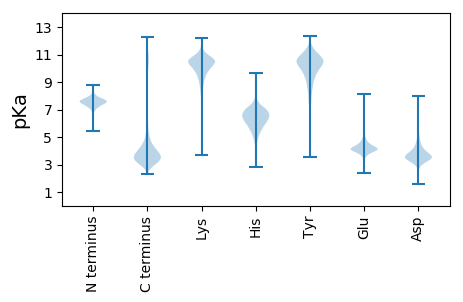
Isoelectric point according different methods:
Protein with the highest isoelectric point:
>tr|S3DCB5|S3DCB5_GLAL2 RNA-binding RBD OS=Glarea lozoyensis (strain ATCC 20868 / MF5171) OX=1116229 GN=GLAREA_08134 PE=4 SV=1
MM1 pKa = 7.41SHH3 pKa = 6.25EE4 pKa = 4.71SVWNSRR10 pKa = 11.84PRR12 pKa = 11.84TYY14 pKa = 11.23GKK16 pKa = 9.94GARR19 pKa = 11.84ACRR22 pKa = 11.84VCTHH26 pKa = 6.71KK27 pKa = 11.0AGLIRR32 pKa = 11.84KK33 pKa = 8.76YY34 pKa = 10.73GLNICRR40 pKa = 11.84QCFRR44 pKa = 11.84EE45 pKa = 3.97KK46 pKa = 10.6AADD49 pKa = 3.13IGFVKK54 pKa = 10.38HH55 pKa = 5.95RR56 pKa = 4.18
MM1 pKa = 7.41SHH3 pKa = 6.25EE4 pKa = 4.71SVWNSRR10 pKa = 11.84PRR12 pKa = 11.84TYY14 pKa = 11.23GKK16 pKa = 9.94GARR19 pKa = 11.84ACRR22 pKa = 11.84VCTHH26 pKa = 6.71KK27 pKa = 11.0AGLIRR32 pKa = 11.84KK33 pKa = 8.76YY34 pKa = 10.73GLNICRR40 pKa = 11.84QCFRR44 pKa = 11.84EE45 pKa = 3.97KK46 pKa = 10.6AADD49 pKa = 3.13IGFVKK54 pKa = 10.38HH55 pKa = 5.95RR56 pKa = 4.18
Molecular weight: 6.46 kDa
Isoelectric point according different methods:
Peptides (in silico digests for buttom-up proteomics)
Below you can find in silico digests of the whole proteome with Trypsin, Chymotrypsin, Trypsin+LysC, LysN, ArgC proteases suitable for different mass spec machines.| Try ESI |
 |
|---|
| ChTry ESI |
 |
|---|
| ArgC ESI |
 |
|---|
| LysN ESI |
 |
|---|
| TryLysC ESI |
 |
|---|
| Try MALDI |
 |
|---|
| ChTry MALDI |
 |
|---|
| ArgC MALDI |
 |
|---|
| LysN MALDI |
 |
|---|
| TryLysC MALDI |
 |
|---|
| Try LTQ |
 |
|---|
| ChTry LTQ |
 |
|---|
| ArgC LTQ |
 |
|---|
| LysN LTQ |
 |
|---|
| TryLysC LTQ |
 |
|---|
| Try MSlow |
 |
|---|
| ChTry MSlow |
 |
|---|
| ArgC MSlow |
 |
|---|
| LysN MSlow |
 |
|---|
| TryLysC MSlow |
 |
|---|
| Try MShigh |
 |
|---|
| ChTry MShigh |
 |
|---|
| ArgC MShigh |
 |
|---|
| LysN MShigh |
 |
|---|
| TryLysC MShigh |
 |
|---|
General Statistics
Number of major isoforms |
Number of additional isoforms |
Number of all proteins |
Number of amino acids |
Min. Seq. Length |
Max. Seq. Length |
Avg. Seq. Length |
Avg. Mol. Weight |
|---|---|---|---|---|---|---|---|
0 |
6275584 |
49 |
7890 |
479.7 |
53.13 |
Amino acid frequency
Ala |
Cys |
Asp |
Glu |
Phe |
Gly |
His |
Ile |
Lys |
Leu |
|---|---|---|---|---|---|---|---|---|---|
8.07 ± 0.016 | 1.237 ± 0.008 |
5.547 ± 0.014 | 6.379 ± 0.019 |
3.771 ± 0.013 | 6.869 ± 0.02 |
2.277 ± 0.008 | 5.202 ± 0.016 |
5.329 ± 0.018 | 8.682 ± 0.025 |
Met |
Asn |
Gln |
Pro |
Arg |
Ser |
Thr |
Val |
Trp |
Tyr |
|---|---|---|---|---|---|---|---|---|---|
2.189 ± 0.008 | 3.994 ± 0.012 |
5.863 ± 0.024 | 3.871 ± 0.016 |
5.742 ± 0.018 | 8.486 ± 0.025 |
6.201 ± 0.016 | 6.062 ± 0.013 |
1.445 ± 0.008 | 2.786 ± 0.01 |
Most of the basic statistics you can see at this page can be downloaded from this CSV file
Proteome-pI is available under Creative Commons Attribution-NoDerivs license, for more details see here
| Reference: Kozlowski LP. Proteome-pI 2.0: Proteome Isoelectric Point Database Update. Nucleic Acids Res. 2021, doi: 10.1093/nar/gkab944 | Contact: Lukasz P. Kozlowski |
