Rotavirus B
Taxonomy: Viruses; Riboviria; Orthornavirae; Duplornaviricota; Resentoviricetes; Reovirales; Reoviridae; Sedoreovirinae; Rotavirus
Average proteome isoelectric point is 6.45
Get precalculated fractions of proteins

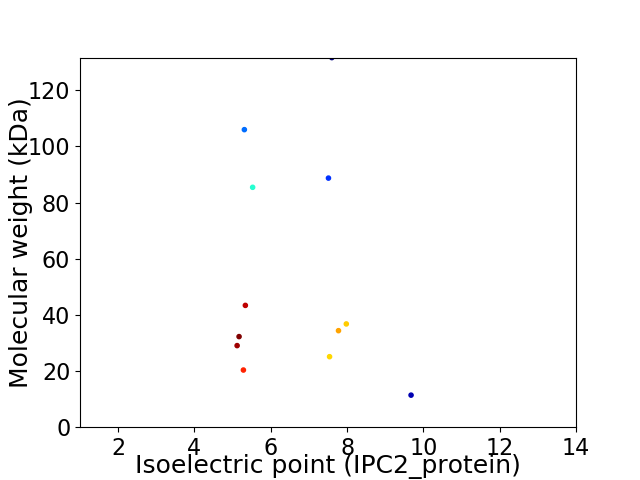
Virtual 2D-PAGE plot for 12 proteins (isoelectric point calculated using IPC2_protein)
Get csv file with sequences according to given criteria:
* You can choose from 21 different methods for calculating isoelectric point
Summary statistics related to proteome-wise predictions


Protein with the lowest isoelectric point:
>tr|A0A0F6QQG0|A0A0F6QQG0_9REOV Non-structural protein 4 OS=Rotavirus B OX=28876 GN=NSP4 PE=4 SV=1
MM1 pKa = 7.9AFTLLLVLAACVNAQLNIVPSIHH24 pKa = 7.29PEE26 pKa = 3.47ICVLYY31 pKa = 10.91SDD33 pKa = 5.75DD34 pKa = 3.8LTDD37 pKa = 3.34AKK39 pKa = 10.85KK40 pKa = 11.03YY41 pKa = 10.34FGNFTKK47 pKa = 10.37IFEE50 pKa = 4.69NYY52 pKa = 8.17NHH54 pKa = 5.32VTISLTNYY62 pKa = 9.89SNSDD66 pKa = 3.23YY67 pKa = 11.51DD68 pKa = 4.68VIDD71 pKa = 3.58ILSKK75 pKa = 10.85HH76 pKa = 6.06NYY78 pKa = 6.59EE79 pKa = 4.4ACDD82 pKa = 3.39VLAIYY87 pKa = 10.05VKK89 pKa = 9.99YY90 pKa = 10.71AYY92 pKa = 9.68MDD94 pKa = 4.02FATFLQSEE102 pKa = 4.46NNCTKK107 pKa = 9.98FAGRR111 pKa = 11.84KK112 pKa = 5.51IHH114 pKa = 6.51YY115 pKa = 8.89VQLPKK120 pKa = 10.0NQEE123 pKa = 3.55WFVYY127 pKa = 10.52SRR129 pKa = 11.84DD130 pKa = 3.66LKK132 pKa = 10.8FCPLSDD138 pKa = 4.04DD139 pKa = 4.87LIGMFCDD146 pKa = 3.56TQLEE150 pKa = 4.43GTYY153 pKa = 10.46FEE155 pKa = 4.48VAPDD159 pKa = 3.21RR160 pKa = 11.84RR161 pKa = 11.84YY162 pKa = 10.86YY163 pKa = 9.35ITDD166 pKa = 2.96IPEE169 pKa = 3.88FTTRR173 pKa = 11.84GYY175 pKa = 8.68TLYY178 pKa = 10.82SNNPFYY184 pKa = 11.05VCQRR188 pKa = 11.84ITEE191 pKa = 4.2RR192 pKa = 11.84PWINVHH198 pKa = 6.04YY199 pKa = 9.38FYY201 pKa = 11.3NDD203 pKa = 3.3NEE205 pKa = 4.23PSGTVSQRR213 pKa = 11.84ISWGNVWTNVTTFAQMLYY231 pKa = 10.23KK232 pKa = 10.32ILDD235 pKa = 3.18IFFNNNRR242 pKa = 11.84SAEE245 pKa = 3.96PRR247 pKa = 11.84AA248 pKa = 3.6
MM1 pKa = 7.9AFTLLLVLAACVNAQLNIVPSIHH24 pKa = 7.29PEE26 pKa = 3.47ICVLYY31 pKa = 10.91SDD33 pKa = 5.75DD34 pKa = 3.8LTDD37 pKa = 3.34AKK39 pKa = 10.85KK40 pKa = 11.03YY41 pKa = 10.34FGNFTKK47 pKa = 10.37IFEE50 pKa = 4.69NYY52 pKa = 8.17NHH54 pKa = 5.32VTISLTNYY62 pKa = 9.89SNSDD66 pKa = 3.23YY67 pKa = 11.51DD68 pKa = 4.68VIDD71 pKa = 3.58ILSKK75 pKa = 10.85HH76 pKa = 6.06NYY78 pKa = 6.59EE79 pKa = 4.4ACDD82 pKa = 3.39VLAIYY87 pKa = 10.05VKK89 pKa = 9.99YY90 pKa = 10.71AYY92 pKa = 9.68MDD94 pKa = 4.02FATFLQSEE102 pKa = 4.46NNCTKK107 pKa = 9.98FAGRR111 pKa = 11.84KK112 pKa = 5.51IHH114 pKa = 6.51YY115 pKa = 8.89VQLPKK120 pKa = 10.0NQEE123 pKa = 3.55WFVYY127 pKa = 10.52SRR129 pKa = 11.84DD130 pKa = 3.66LKK132 pKa = 10.8FCPLSDD138 pKa = 4.04DD139 pKa = 4.87LIGMFCDD146 pKa = 3.56TQLEE150 pKa = 4.43GTYY153 pKa = 10.46FEE155 pKa = 4.48VAPDD159 pKa = 3.21RR160 pKa = 11.84RR161 pKa = 11.84YY162 pKa = 10.86YY163 pKa = 9.35ITDD166 pKa = 2.96IPEE169 pKa = 3.88FTTRR173 pKa = 11.84GYY175 pKa = 8.68TLYY178 pKa = 10.82SNNPFYY184 pKa = 11.05VCQRR188 pKa = 11.84ITEE191 pKa = 4.2RR192 pKa = 11.84PWINVHH198 pKa = 6.04YY199 pKa = 9.38FYY201 pKa = 11.3NDD203 pKa = 3.3NEE205 pKa = 4.23PSGTVSQRR213 pKa = 11.84ISWGNVWTNVTTFAQMLYY231 pKa = 10.23KK232 pKa = 10.32ILDD235 pKa = 3.18IFFNNNRR242 pKa = 11.84SAEE245 pKa = 3.96PRR247 pKa = 11.84AA248 pKa = 3.6
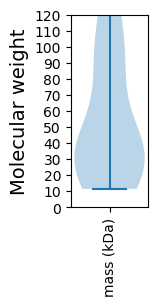
Molecular weight: 29.05 kDa
Isoelectric point according different methods:
Protein with the highest isoelectric point:
>tr|A0A0F6T671|A0A0F6T671_9REOV Isoform of A0A0F6QPK6 Non-structural protein NSP1.pep1 OS=Rotavirus B OX=28876 GN=NSP1 PE=4 SV=1
MM1 pKa = 7.79GNRR4 pKa = 11.84QSSLQSQTHH13 pKa = 4.86RR14 pKa = 11.84TDD16 pKa = 3.43INSHH20 pKa = 5.63NSNIYY25 pKa = 9.39LQSASFAEE33 pKa = 4.69FKK35 pKa = 10.19TYY37 pKa = 10.65HH38 pKa = 6.37LLITVGAALIALLFAFLISSLVCNCYY64 pKa = 10.43LLRR67 pKa = 11.84RR68 pKa = 11.84LRR70 pKa = 11.84NGPRR74 pKa = 11.84KK75 pKa = 9.54IYY77 pKa = 9.02RR78 pKa = 11.84TSQVQEE84 pKa = 3.99GSSPVLSKK92 pKa = 10.86QLIRR96 pKa = 11.84SDD98 pKa = 3.51NFVV101 pKa = 2.9
MM1 pKa = 7.79GNRR4 pKa = 11.84QSSLQSQTHH13 pKa = 4.86RR14 pKa = 11.84TDD16 pKa = 3.43INSHH20 pKa = 5.63NSNIYY25 pKa = 9.39LQSASFAEE33 pKa = 4.69FKK35 pKa = 10.19TYY37 pKa = 10.65HH38 pKa = 6.37LLITVGAALIALLFAFLISSLVCNCYY64 pKa = 10.43LLRR67 pKa = 11.84RR68 pKa = 11.84LRR70 pKa = 11.84NGPRR74 pKa = 11.84KK75 pKa = 9.54IYY77 pKa = 9.02RR78 pKa = 11.84TSQVQEE84 pKa = 3.99GSSPVLSKK92 pKa = 10.86QLIRR96 pKa = 11.84SDD98 pKa = 3.51NFVV101 pKa = 2.9
Molecular weight: 11.42 kDa
Isoelectric point according different methods:
Peptides (in silico digests for buttom-up proteomics)
Below you can find in silico digests of the whole proteome with Trypsin, Chymotrypsin, Trypsin+LysC, LysN, ArgC proteases suitable for different mass spec machines.| Try ESI |
 |
|---|
| ChTry ESI |
 |
|---|
| ArgC ESI |
 |
|---|
| LysN ESI |
 |
|---|
| TryLysC ESI |
 |
|---|
| Try MALDI |
 |
|---|
| ChTry MALDI |
 |
|---|
| ArgC MALDI |
 |
|---|
| LysN MALDI |
 |
|---|
| TryLysC MALDI |
 |
|---|
| Try LTQ |
 |
|---|
| ChTry LTQ |
 |
|---|
| ArgC LTQ |
 |
|---|
| LysN LTQ |
 |
|---|
| TryLysC LTQ |
 |
|---|
| Try MSlow |
 |
|---|
| ChTry MSlow |
 |
|---|
| ArgC MSlow |
 |
|---|
| LysN MSlow |
 |
|---|
| TryLysC MSlow |
 |
|---|
| Try MShigh |
 |
|---|
| ChTry MShigh |
 |
|---|
| ArgC MShigh |
 |
|---|
| LysN MShigh |
 |
|---|
| TryLysC MShigh |
 |
|---|
General Statistics
Number of major isoforms |
Number of additional isoforms |
Number of all proteins |
Number of amino acids |
Min. Seq. Length |
Max. Seq. Length |
Avg. Seq. Length |
Avg. Mol. Weight |
|---|---|---|---|---|---|---|---|
5641 |
101 |
1160 |
470.1 |
53.7 |
Amino acid frequency
Ala |
Cys |
Asp |
Glu |
Phe |
Gly |
His |
Ile |
Lys |
Leu |
|---|---|---|---|---|---|---|---|---|---|
5.832 ± 0.563 | 1.383 ± 0.273 |
6.169 ± 0.354 | 5.885 ± 0.55 |
4.556 ± 0.379 | 3.953 ± 0.425 |
1.95 ± 0.383 | 7.782 ± 0.276 |
6.559 ± 0.52 | 8.935 ± 0.51 |
Met |
Asn |
Gln |
Pro |
Arg |
Ser |
Thr |
Val |
Trp |
Tyr |
|---|---|---|---|---|---|---|---|---|---|
2.358 ± 0.187 | 6.329 ± 0.47 |
3.723 ± 0.287 | 4.113 ± 0.191 |
5.212 ± 0.309 | 7.995 ± 0.4 |
6.506 ± 0.368 | 5.761 ± 0.31 |
0.922 ± 0.123 | 4.077 ± 0.437 |
Most of the basic statistics you can see at this page can be downloaded from this CSV file
Proteome-pI is available under Creative Commons Attribution-NoDerivs license, for more details see here
| Reference: Kozlowski LP. Proteome-pI 2.0: Proteome Isoelectric Point Database Update. Nucleic Acids Res. 2021, doi: 10.1093/nar/gkab944 | Contact: Lukasz P. Kozlowski |
