Pectobacterium phage MA13
Taxonomy: Viruses; Duplodnaviria; Heunggongvirae; Uroviricota; Caudoviricetes; Caudovirales; Autographiviridae; Melnykvirinae; unclassified Melnykvirinae
Average proteome isoelectric point is 6.45
Get precalculated fractions of proteins

Virtual 2D-PAGE plot for 33 proteins (isoelectric point calculated using IPC2_protein)
Get csv file with sequences according to given criteria:
* You can choose from 21 different methods for calculating isoelectric point
Summary statistics related to proteome-wise predictions


Protein with the lowest isoelectric point:
>tr|A0A5Q2F5J8|A0A5Q2F5J8_9CAUD Tail fiber protein OS=Pectobacterium phage MA13 OX=2662284 GN=MA13_gp27 PE=4 SV=1
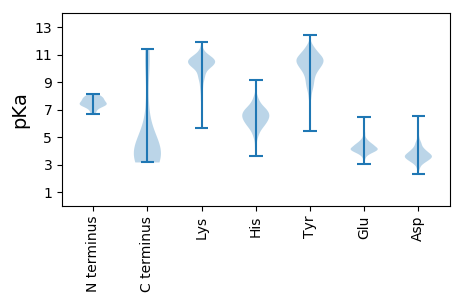
MM1 pKa = 7.68RR2 pKa = 11.84NVIDD6 pKa = 3.72VNPYY10 pKa = 9.63IRR12 pKa = 11.84TFLASEE18 pKa = 4.73LGDD21 pKa = 3.55QIARR25 pKa = 11.84GLFKK29 pKa = 10.54QVGVIRR35 pKa = 11.84TEE37 pKa = 3.98YY38 pKa = 9.16VQQDD42 pKa = 3.5GTTTRR47 pKa = 11.84SMEE50 pKa = 4.01AVIHH54 pKa = 6.65DD55 pKa = 3.89LHH57 pKa = 7.87LDD59 pKa = 3.03KK60 pKa = 11.06LYY62 pKa = 11.0AVEE65 pKa = 4.18QYY67 pKa = 10.59RR68 pKa = 11.84GLAIRR73 pKa = 11.84AEE75 pKa = 4.35VVDD78 pKa = 4.69EE79 pKa = 4.24EE80 pKa = 4.66MLAQMRR86 pKa = 11.84EE87 pKa = 4.14VLPTLAEE94 pKa = 4.51GEE96 pKa = 4.48GFTYY100 pKa = 10.04DD101 pKa = 3.26QRR103 pKa = 11.84IVQDD107 pKa = 3.93VVDD110 pKa = 4.12VAPVDD115 pKa = 3.65EE116 pKa = 4.72SRR118 pKa = 11.84ILAQPLTGEE127 pKa = 4.25EE128 pKa = 4.5GLNGG132 pKa = 3.63
MM1 pKa = 7.68RR2 pKa = 11.84NVIDD6 pKa = 3.72VNPYY10 pKa = 9.63IRR12 pKa = 11.84TFLASEE18 pKa = 4.73LGDD21 pKa = 3.55QIARR25 pKa = 11.84GLFKK29 pKa = 10.54QVGVIRR35 pKa = 11.84TEE37 pKa = 3.98YY38 pKa = 9.16VQQDD42 pKa = 3.5GTTTRR47 pKa = 11.84SMEE50 pKa = 4.01AVIHH54 pKa = 6.65DD55 pKa = 3.89LHH57 pKa = 7.87LDD59 pKa = 3.03KK60 pKa = 11.06LYY62 pKa = 11.0AVEE65 pKa = 4.18QYY67 pKa = 10.59RR68 pKa = 11.84GLAIRR73 pKa = 11.84AEE75 pKa = 4.35VVDD78 pKa = 4.69EE79 pKa = 4.24EE80 pKa = 4.66MLAQMRR86 pKa = 11.84EE87 pKa = 4.14VLPTLAEE94 pKa = 4.51GEE96 pKa = 4.48GFTYY100 pKa = 10.04DD101 pKa = 3.26QRR103 pKa = 11.84IVQDD107 pKa = 3.93VVDD110 pKa = 4.12VAPVDD115 pKa = 3.65EE116 pKa = 4.72SRR118 pKa = 11.84ILAQPLTGEE127 pKa = 4.25EE128 pKa = 4.5GLNGG132 pKa = 3.63
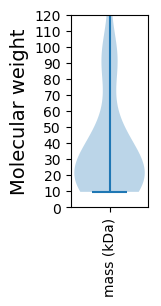
Molecular weight: 14.82 kDa
Isoelectric point according different methods:
Protein with the highest isoelectric point:
>tr|A0A5Q2F5I7|A0A5Q2F5I7_9CAUD Uncharacterized protein OS=Pectobacterium phage MA13 OX=2662284 GN=MA13_gp17 PE=4 SV=1
MM1 pKa = 7.37GLDD4 pKa = 3.22GCGYY8 pKa = 8.53SRR10 pKa = 11.84KK11 pKa = 9.22PVRR14 pKa = 11.84CYY16 pKa = 10.12PWTVDD21 pKa = 3.0VGGGGRR27 pKa = 11.84VNQVVYY33 pKa = 10.35VAAPAQHH40 pKa = 5.92VDD42 pKa = 2.82ARR44 pKa = 11.84TVRR47 pKa = 11.84AAAARR52 pKa = 11.84TKK54 pKa = 10.65GKK56 pKa = 9.05WEE58 pKa = 3.82SVQRR62 pKa = 11.84VTKK65 pKa = 9.96EE66 pKa = 3.33RR67 pKa = 11.84HH68 pKa = 3.68QQARR72 pKa = 11.84SALRR76 pKa = 11.84MHH78 pKa = 6.75YY79 pKa = 9.79EE80 pKa = 4.07SKK82 pKa = 11.28ANALGMTLAGYY93 pKa = 7.32CQRR96 pKa = 11.84FGVKK100 pKa = 9.62LL101 pKa = 3.48
MM1 pKa = 7.37GLDD4 pKa = 3.22GCGYY8 pKa = 8.53SRR10 pKa = 11.84KK11 pKa = 9.22PVRR14 pKa = 11.84CYY16 pKa = 10.12PWTVDD21 pKa = 3.0VGGGGRR27 pKa = 11.84VNQVVYY33 pKa = 10.35VAAPAQHH40 pKa = 5.92VDD42 pKa = 2.82ARR44 pKa = 11.84TVRR47 pKa = 11.84AAAARR52 pKa = 11.84TKK54 pKa = 10.65GKK56 pKa = 9.05WEE58 pKa = 3.82SVQRR62 pKa = 11.84VTKK65 pKa = 9.96EE66 pKa = 3.33RR67 pKa = 11.84HH68 pKa = 3.68QQARR72 pKa = 11.84SALRR76 pKa = 11.84MHH78 pKa = 6.75YY79 pKa = 9.79EE80 pKa = 4.07SKK82 pKa = 11.28ANALGMTLAGYY93 pKa = 7.32CQRR96 pKa = 11.84FGVKK100 pKa = 9.62LL101 pKa = 3.48
Molecular weight: 11.14 kDa
Isoelectric point according different methods:
Peptides (in silico digests for buttom-up proteomics)
Below you can find in silico digests of the whole proteome with Trypsin, Chymotrypsin, Trypsin+LysC, LysN, ArgC proteases suitable for different mass spec machines.| Try ESI |
 |
|---|
| ChTry ESI |
 |
|---|
| ArgC ESI |
 |
|---|
| LysN ESI |
 |
|---|
| TryLysC ESI |
 |
|---|
| Try MALDI |
 |
|---|
| ChTry MALDI |
 |
|---|
| ArgC MALDI |
 |
|---|
| LysN MALDI |
 |
|---|
| TryLysC MALDI |
 |
|---|
| Try LTQ |
 |
|---|
| ChTry LTQ |
 |
|---|
| ArgC LTQ |
 |
|---|
| LysN LTQ |
 |
|---|
| TryLysC LTQ |
 |
|---|
| Try MSlow |
 |
|---|
| ChTry MSlow |
 |
|---|
| ArgC MSlow |
 |
|---|
| LysN MSlow |
 |
|---|
| TryLysC MSlow |
 |
|---|
| Try MShigh |
 |
|---|
| ChTry MShigh |
 |
|---|
| ArgC MShigh |
 |
|---|
| LysN MShigh |
 |
|---|
| TryLysC MShigh |
 |
|---|
General Statistics
Number of major isoforms |
Number of additional isoforms |
Number of all proteins |
Number of amino acids |
Min. Seq. Length |
Max. Seq. Length |
Avg. Seq. Length |
Avg. Mol. Weight |
|---|---|---|---|---|---|---|---|
0 |
11317 |
88 |
1260 |
342.9 |
38.03 |
Amino acid frequency
Ala |
Cys |
Asp |
Glu |
Phe |
Gly |
His |
Ile |
Lys |
Leu |
|---|---|---|---|---|---|---|---|---|---|
9.861 ± 0.573 | 0.848 ± 0.133 |
6.459 ± 0.138 | 6.106 ± 0.307 |
3.499 ± 0.208 | 7.917 ± 0.356 |
1.829 ± 0.173 | 4.144 ± 0.259 |
6.185 ± 0.286 | 8.43 ± 0.416 |
Met |
Asn |
Gln |
Pro |
Arg |
Ser |
Thr |
Val |
Trp |
Tyr |
|---|---|---|---|---|---|---|---|---|---|
3.243 ± 0.222 | 4.065 ± 0.226 |
4.277 ± 0.23 | 4.754 ± 0.464 |
5.505 ± 0.259 | 5.814 ± 0.256 |
5.434 ± 0.353 | 6.68 ± 0.366 |
1.396 ± 0.145 | 3.552 ± 0.203 |
Most of the basic statistics you can see at this page can be downloaded from this CSV file
Proteome-pI is available under Creative Commons Attribution-NoDerivs license, for more details see here
| Reference: Kozlowski LP. Proteome-pI 2.0: Proteome Isoelectric Point Database Update. Nucleic Acids Res. 2021, doi: 10.1093/nar/gkab944 | Contact: Lukasz P. Kozlowski |
