Ophiostoma piceae (strain UAMH 11346) (Sap stain fungus)
Taxonomy: cellular organisms; Eukaryota; Opisthokonta; Fungi; Dikarya; Ascomycota; saccharomyceta; Pezizomycotina; leotiomyceta; sordariomyceta; Sordariomycetes; Sordariomycetidae; Ophiostomatales; Ophiostomataceae; Ophiostoma; Ophiostoma piceae
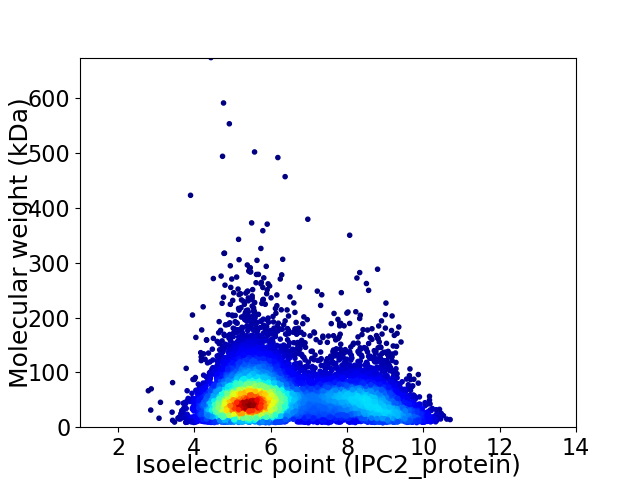
Average proteome isoelectric point is 6.43
Get precalculated fractions of proteins

Virtual 2D-PAGE plot for 8878 proteins (isoelectric point calculated using IPC2_protein)
Get csv file with sequences according to given criteria:
* You can choose from 21 different methods for calculating isoelectric point
Summary statistics related to proteome-wise predictions


Protein with the lowest isoelectric point:
>tr|S3D3M5|S3D3M5_OPHP1 Gamma-glutamyltranspeptidase OS=Ophiostoma piceae (strain UAMH 11346) OX=1262450 GN=F503_00738 PE=4 SV=1
MM1 pKa = 7.58LLAKK5 pKa = 10.12QFIPLLIAAAINVNAQVDD23 pKa = 4.28LGTALSFGVLGSSTVTNTGPTTIEE47 pKa = 3.88GDD49 pKa = 3.66VGVSPGTAITGFPPGIVTDD68 pKa = 4.45GTTHH72 pKa = 7.37AGDD75 pKa = 3.48AVAAQAQSDD84 pKa = 3.97ALTAYY89 pKa = 9.69NQAAGQSAGVDD100 pKa = 3.61LTDD103 pKa = 4.31QDD105 pKa = 5.15LGDD108 pKa = 4.05LRR110 pKa = 11.84LTPGVYY116 pKa = 9.46TFASSAQLTGSLTLDD131 pKa = 3.3AQGNTDD137 pKa = 3.85SFWIFQIDD145 pKa = 3.86STLTTATDD153 pKa = 3.31SSVILVNGASSCNVFWQVGSSATLGSGTAFSGNILALEE191 pKa = 4.54SITLVSEE198 pKa = 4.12STVDD202 pKa = 3.54VVVLFVEE209 pKa = 4.88SIVFFIFHH217 pKa = 5.32NHH219 pKa = 4.55IVNYY223 pKa = 10.16DD224 pKa = 3.68IIIVFFFHH232 pKa = 7.44ASIIFLL238 pKa = 4.1
MM1 pKa = 7.58LLAKK5 pKa = 10.12QFIPLLIAAAINVNAQVDD23 pKa = 4.28LGTALSFGVLGSSTVTNTGPTTIEE47 pKa = 3.88GDD49 pKa = 3.66VGVSPGTAITGFPPGIVTDD68 pKa = 4.45GTTHH72 pKa = 7.37AGDD75 pKa = 3.48AVAAQAQSDD84 pKa = 3.97ALTAYY89 pKa = 9.69NQAAGQSAGVDD100 pKa = 3.61LTDD103 pKa = 4.31QDD105 pKa = 5.15LGDD108 pKa = 4.05LRR110 pKa = 11.84LTPGVYY116 pKa = 9.46TFASSAQLTGSLTLDD131 pKa = 3.3AQGNTDD137 pKa = 3.85SFWIFQIDD145 pKa = 3.86STLTTATDD153 pKa = 3.31SSVILVNGASSCNVFWQVGSSATLGSGTAFSGNILALEE191 pKa = 4.54SITLVSEE198 pKa = 4.12STVDD202 pKa = 3.54VVVLFVEE209 pKa = 4.88SIVFFIFHH217 pKa = 5.32NHH219 pKa = 4.55IVNYY223 pKa = 10.16DD224 pKa = 3.68IIIVFFFHH232 pKa = 7.44ASIIFLL238 pKa = 4.1
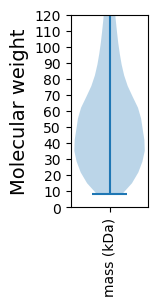
Molecular weight: 24.53 kDa
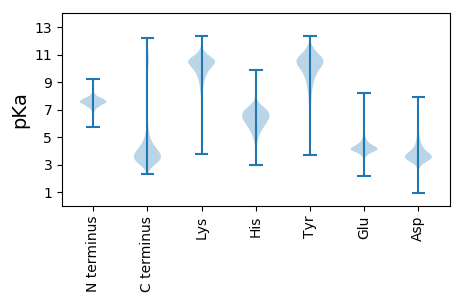
Isoelectric point according different methods:
Protein with the highest isoelectric point:
>tr|S3C0U1|S3C0U1_OPHP1 Uncharacterized protein OS=Ophiostoma piceae (strain UAMH 11346) OX=1262450 GN=F503_07800 PE=4 SV=1
MM1 pKa = 7.92PSTAPRR7 pKa = 11.84RR8 pKa = 11.84PVLSDD13 pKa = 3.23PSVLATMLPSALSLSPARR31 pKa = 11.84LRR33 pKa = 11.84AAAHH37 pKa = 5.89SVHH40 pKa = 6.59IGNDD44 pKa = 3.37ALHH47 pKa = 6.82LKK49 pKa = 10.02PSYY52 pKa = 11.01SLVPSAQPIDD62 pKa = 3.97AACVPPSSASDD73 pKa = 3.0VHH75 pKa = 6.45RR76 pKa = 11.84RR77 pKa = 11.84NPHH80 pKa = 3.99VQLRR84 pKa = 11.84VQARR88 pKa = 11.84RR89 pKa = 11.84RR90 pKa = 11.84LRR92 pKa = 11.84QCEE95 pKa = 4.09KK96 pKa = 10.71RR97 pKa = 11.84SGTNVKK103 pKa = 8.55CTPLTEE109 pKa = 4.24VAQPGILHH117 pKa = 5.76YY118 pKa = 10.26CKK120 pKa = 10.41SHH122 pKa = 6.95LVPPDD127 pKa = 3.23SAAVMYY133 pKa = 9.68RR134 pKa = 11.84SPRR137 pKa = 11.84PATEE141 pKa = 3.47
MM1 pKa = 7.92PSTAPRR7 pKa = 11.84RR8 pKa = 11.84PVLSDD13 pKa = 3.23PSVLATMLPSALSLSPARR31 pKa = 11.84LRR33 pKa = 11.84AAAHH37 pKa = 5.89SVHH40 pKa = 6.59IGNDD44 pKa = 3.37ALHH47 pKa = 6.82LKK49 pKa = 10.02PSYY52 pKa = 11.01SLVPSAQPIDD62 pKa = 3.97AACVPPSSASDD73 pKa = 3.0VHH75 pKa = 6.45RR76 pKa = 11.84RR77 pKa = 11.84NPHH80 pKa = 3.99VQLRR84 pKa = 11.84VQARR88 pKa = 11.84RR89 pKa = 11.84RR90 pKa = 11.84LRR92 pKa = 11.84QCEE95 pKa = 4.09KK96 pKa = 10.71RR97 pKa = 11.84SGTNVKK103 pKa = 8.55CTPLTEE109 pKa = 4.24VAQPGILHH117 pKa = 5.76YY118 pKa = 10.26CKK120 pKa = 10.41SHH122 pKa = 6.95LVPPDD127 pKa = 3.23SAAVMYY133 pKa = 9.68RR134 pKa = 11.84SPRR137 pKa = 11.84PATEE141 pKa = 3.47
Molecular weight: 15.25 kDa
Isoelectric point according different methods:
Peptides (in silico digests for buttom-up proteomics)
Below you can find in silico digests of the whole proteome with Trypsin, Chymotrypsin, Trypsin+LysC, LysN, ArgC proteases suitable for different mass spec machines.| Try ESI |
 |
|---|
| ChTry ESI |
 |
|---|
| ArgC ESI |
 |
|---|
| LysN ESI |
 |
|---|
| TryLysC ESI |
 |
|---|
| Try MALDI |
 |
|---|
| ChTry MALDI |
 |
|---|
| ArgC MALDI |
 |
|---|
| LysN MALDI |
 |
|---|
| TryLysC MALDI |
 |
|---|
| Try LTQ |
 |
|---|
| ChTry LTQ |
 |
|---|
| ArgC LTQ |
 |
|---|
| LysN LTQ |
 |
|---|
| TryLysC LTQ |
 |
|---|
| Try MSlow |
 |
|---|
| ChTry MSlow |
 |
|---|
| ArgC MSlow |
 |
|---|
| LysN MSlow |
 |
|---|
| TryLysC MSlow |
 |
|---|
| Try MShigh |
 |
|---|
| ChTry MShigh |
 |
|---|
| ArgC MShigh |
 |
|---|
| LysN MShigh |
 |
|---|
| TryLysC MShigh |
 |
|---|
General Statistics
Number of major isoforms |
Number of additional isoforms |
Number of all proteins |
Number of amino acids |
Min. Seq. Length |
Max. Seq. Length |
Avg. Seq. Length |
Avg. Mol. Weight |
|---|---|---|---|---|---|---|---|
0 |
4937363 |
80 |
6385 |
556.1 |
60.69 |
Amino acid frequency
Ala |
Cys |
Asp |
Glu |
Phe |
Gly |
His |
Ile |
Lys |
Leu |
|---|---|---|---|---|---|---|---|---|---|
10.237 ± 0.027 | 1.079 ± 0.01 |
5.96 ± 0.022 | 5.631 ± 0.029 |
3.385 ± 0.015 | 7.177 ± 0.021 |
2.4 ± 0.014 | 4.303 ± 0.015 |
4.315 ± 0.024 | 8.411 ± 0.025 |
Met |
Asn |
Gln |
Pro |
Arg |
Ser |
Thr |
Val |
Trp |
Tyr |
|---|---|---|---|---|---|---|---|---|---|
2.157 ± 0.01 | 3.495 ± 0.012 |
6.244 ± 0.027 | 3.978 ± 0.021 |
6.144 ± 0.019 | 8.765 ± 0.036 |
6.197 ± 0.02 | 6.219 ± 0.021 |
1.272 ± 0.008 | 2.63 ± 0.012 |
Most of the basic statistics you can see at this page can be downloaded from this CSV file
Proteome-pI is available under Creative Commons Attribution-NoDerivs license, for more details see here
| Reference: Kozlowski LP. Proteome-pI 2.0: Proteome Isoelectric Point Database Update. Nucleic Acids Res. 2021, doi: 10.1093/nar/gkab944 | Contact: Lukasz P. Kozlowski |
