Phascolarctobacterium sp. CAG:266
Taxonomy: cellular organisms; Bacteria; Terrabacteria group; Firmicutes; Negativicutes; Acidaminococcales; Acidaminococcaceae; Phascolarctobacterium; unclassified Phascolarctobacterium
Average proteome isoelectric point is 6.41
Get precalculated fractions of proteins

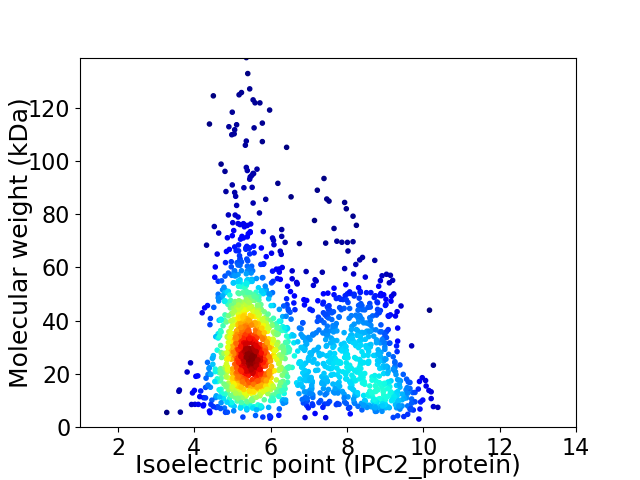
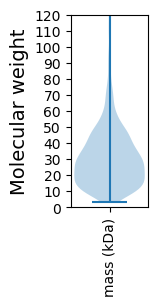
Virtual 2D-PAGE plot for 1778 proteins (isoelectric point calculated using IPC2_protein)
Get csv file with sequences according to given criteria:
* You can choose from 21 different methods for calculating isoelectric point
Summary statistics related to proteome-wise predictions


Protein with the lowest isoelectric point:
>tr|R6HSF5|R6HSF5_9FIRM Fused DNA binding domain of the MerR-like transcription regulator and aldo/keto reductase family oxidoreductase OS=Phascolarctobacterium sp. CAG:266 OX=1262915 GN=BN574_00443 PE=4 SV=1
MM1 pKa = 8.26DD2 pKa = 5.6DD3 pKa = 3.48NKK5 pKa = 10.74EE6 pKa = 3.86FEE8 pKa = 4.9LEE10 pKa = 3.78HH11 pKa = 7.5DD12 pKa = 5.02HH13 pKa = 8.25IDD15 pKa = 3.45EE16 pKa = 4.34EE17 pKa = 4.87EE18 pKa = 4.13IVVITDD24 pKa = 3.05EE25 pKa = 5.4DD26 pKa = 4.13GNEE29 pKa = 3.78MYY31 pKa = 10.32FRR33 pKa = 11.84EE34 pKa = 4.27EE35 pKa = 3.5MVIPVGEE42 pKa = 4.05KK43 pKa = 10.3SFAVLSALDD52 pKa = 4.97ADD54 pKa = 4.38DD55 pKa = 5.46CGCEE59 pKa = 4.81DD60 pKa = 4.82EE61 pKa = 5.51EE62 pKa = 4.87CHH64 pKa = 6.9CHH66 pKa = 7.45DD67 pKa = 5.5EE68 pKa = 4.94EE69 pKa = 7.39DD70 pKa = 4.15DD71 pKa = 5.33DD72 pKa = 4.54EE73 pKa = 6.73DD74 pKa = 3.81NVIIARR80 pKa = 11.84IDD82 pKa = 3.43FDD84 pKa = 4.16EE85 pKa = 5.56DD86 pKa = 3.52GNEE89 pKa = 4.05IYY91 pKa = 10.7LGPTDD96 pKa = 4.18EE97 pKa = 4.62EE98 pKa = 4.47FEE100 pKa = 4.42EE101 pKa = 4.61VKK103 pKa = 10.51AAYY106 pKa = 7.73EE107 pKa = 3.98KK108 pKa = 10.98LVAEE112 pKa = 4.47WDD114 pKa = 3.75EE115 pKa = 4.26EE116 pKa = 4.28
MM1 pKa = 8.26DD2 pKa = 5.6DD3 pKa = 3.48NKK5 pKa = 10.74EE6 pKa = 3.86FEE8 pKa = 4.9LEE10 pKa = 3.78HH11 pKa = 7.5DD12 pKa = 5.02HH13 pKa = 8.25IDD15 pKa = 3.45EE16 pKa = 4.34EE17 pKa = 4.87EE18 pKa = 4.13IVVITDD24 pKa = 3.05EE25 pKa = 5.4DD26 pKa = 4.13GNEE29 pKa = 3.78MYY31 pKa = 10.32FRR33 pKa = 11.84EE34 pKa = 4.27EE35 pKa = 3.5MVIPVGEE42 pKa = 4.05KK43 pKa = 10.3SFAVLSALDD52 pKa = 4.97ADD54 pKa = 4.38DD55 pKa = 5.46CGCEE59 pKa = 4.81DD60 pKa = 4.82EE61 pKa = 5.51EE62 pKa = 4.87CHH64 pKa = 6.9CHH66 pKa = 7.45DD67 pKa = 5.5EE68 pKa = 4.94EE69 pKa = 7.39DD70 pKa = 4.15DD71 pKa = 5.33DD72 pKa = 4.54EE73 pKa = 6.73DD74 pKa = 3.81NVIIARR80 pKa = 11.84IDD82 pKa = 3.43FDD84 pKa = 4.16EE85 pKa = 5.56DD86 pKa = 3.52GNEE89 pKa = 4.05IYY91 pKa = 10.7LGPTDD96 pKa = 4.18EE97 pKa = 4.62EE98 pKa = 4.47FEE100 pKa = 4.42EE101 pKa = 4.61VKK103 pKa = 10.51AAYY106 pKa = 7.73EE107 pKa = 3.98KK108 pKa = 10.98LVAEE112 pKa = 4.47WDD114 pKa = 3.75EE115 pKa = 4.26EE116 pKa = 4.28
Molecular weight: 13.47 kDa
Isoelectric point according different methods:
Protein with the highest isoelectric point:
>tr|R6HNN0|R6HNN0_9FIRM Uncharacterized protein OS=Phascolarctobacterium sp. CAG:266 OX=1262915 GN=BN574_00953 PE=4 SV=1
MM1 pKa = 7.01KK2 pKa = 10.06RR3 pKa = 11.84EE4 pKa = 3.64RR5 pKa = 11.84GRR7 pKa = 11.84RR8 pKa = 11.84PRR10 pKa = 11.84RR11 pKa = 11.84KK12 pKa = 8.8VCSFCVDD19 pKa = 3.07KK20 pKa = 11.64VEE22 pKa = 4.69EE23 pKa = 4.03IDD25 pKa = 3.85YY26 pKa = 11.21KK27 pKa = 11.24DD28 pKa = 3.4VAKK31 pKa = 10.38LRR33 pKa = 11.84RR34 pKa = 11.84YY35 pKa = 7.26ITEE38 pKa = 3.89RR39 pKa = 11.84GKK41 pKa = 10.13ILPRR45 pKa = 11.84RR46 pKa = 11.84ISGNCAKK53 pKa = 10.1HH54 pKa = 4.55QRR56 pKa = 11.84QMTTAIKK63 pKa = 10.19RR64 pKa = 11.84ARR66 pKa = 11.84NVALLPFTCEE76 pKa = 3.61
MM1 pKa = 7.01KK2 pKa = 10.06RR3 pKa = 11.84EE4 pKa = 3.64RR5 pKa = 11.84GRR7 pKa = 11.84RR8 pKa = 11.84PRR10 pKa = 11.84RR11 pKa = 11.84KK12 pKa = 8.8VCSFCVDD19 pKa = 3.07KK20 pKa = 11.64VEE22 pKa = 4.69EE23 pKa = 4.03IDD25 pKa = 3.85YY26 pKa = 11.21KK27 pKa = 11.24DD28 pKa = 3.4VAKK31 pKa = 10.38LRR33 pKa = 11.84RR34 pKa = 11.84YY35 pKa = 7.26ITEE38 pKa = 3.89RR39 pKa = 11.84GKK41 pKa = 10.13ILPRR45 pKa = 11.84RR46 pKa = 11.84ISGNCAKK53 pKa = 10.1HH54 pKa = 4.55QRR56 pKa = 11.84QMTTAIKK63 pKa = 10.19RR64 pKa = 11.84ARR66 pKa = 11.84NVALLPFTCEE76 pKa = 3.61
Molecular weight: 9.05 kDa
Isoelectric point according different methods:
Peptides (in silico digests for buttom-up proteomics)
Below you can find in silico digests of the whole proteome with Trypsin, Chymotrypsin, Trypsin+LysC, LysN, ArgC proteases suitable for different mass spec machines.| Try ESI |
 |
|---|
| ChTry ESI |
 |
|---|
| ArgC ESI |
 |
|---|
| LysN ESI |
 |
|---|
| TryLysC ESI |
 |
|---|
| Try MALDI |
 |
|---|
| ChTry MALDI |
 |
|---|
| ArgC MALDI |
 |
|---|
| LysN MALDI |
 |
|---|
| TryLysC MALDI |
 |
|---|
| Try LTQ |
 |
|---|
| ChTry LTQ |
 |
|---|
| ArgC LTQ |
 |
|---|
| LysN LTQ |
 |
|---|
| TryLysC LTQ |
 |
|---|
| Try MSlow |
 |
|---|
| ChTry MSlow |
 |
|---|
| ArgC MSlow |
 |
|---|
| LysN MSlow |
 |
|---|
| TryLysC MSlow |
 |
|---|
| Try MShigh |
 |
|---|
| ChTry MShigh |
 |
|---|
| ArgC MShigh |
 |
|---|
| LysN MShigh |
 |
|---|
| TryLysC MShigh |
 |
|---|
General Statistics
Number of major isoforms |
Number of additional isoforms |
Number of all proteins |
Number of amino acids |
Min. Seq. Length |
Max. Seq. Length |
Avg. Seq. Length |
Avg. Mol. Weight |
|---|---|---|---|---|---|---|---|
0 |
509914 |
30 |
1231 |
286.8 |
31.74 |
Amino acid frequency
Ala |
Cys |
Asp |
Glu |
Phe |
Gly |
His |
Ile |
Lys |
Leu |
|---|---|---|---|---|---|---|---|---|---|
9.438 ± 0.061 | 1.418 ± 0.025 |
5.221 ± 0.044 | 6.773 ± 0.061 |
4.124 ± 0.047 | 7.525 ± 0.056 |
1.772 ± 0.026 | 6.959 ± 0.046 |
6.688 ± 0.056 | 9.507 ± 0.062 |
Met |
Asn |
Gln |
Pro |
Arg |
Ser |
Thr |
Val |
Trp |
Tyr |
|---|---|---|---|---|---|---|---|---|---|
3.026 ± 0.029 | 4.425 ± 0.048 |
3.664 ± 0.032 | 3.063 ± 0.034 |
4.413 ± 0.047 | 5.017 ± 0.037 |
5.186 ± 0.04 | 7.303 ± 0.052 |
0.852 ± 0.019 | 3.597 ± 0.039 |
Most of the basic statistics you can see at this page can be downloaded from this CSV file
Proteome-pI is available under Creative Commons Attribution-NoDerivs license, for more details see here
| Reference: Kozlowski LP. Proteome-pI 2.0: Proteome Isoelectric Point Database Update. Nucleic Acids Res. 2021, doi: 10.1093/nar/gkab944 | Contact: Lukasz P. Kozlowski |
