Yoonia litorea
Taxonomy: cellular organisms; Bacteria; Proteobacteria; Alphaproteobacteria; Rhodobacterales; Rhodobacteraceae; Yoonia
Average proteome isoelectric point is 5.96
Get precalculated fractions of proteins

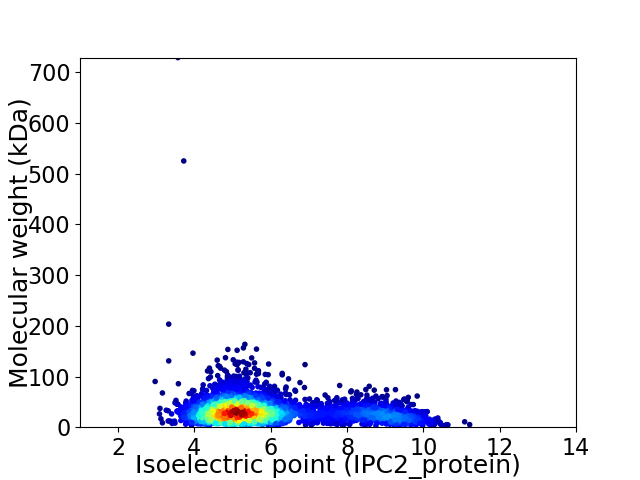
Virtual 2D-PAGE plot for 3293 proteins (isoelectric point calculated using IPC2_protein)
Get csv file with sequences according to given criteria:
* You can choose from 21 different methods for calculating isoelectric point
Summary statistics related to proteome-wise predictions


Protein with the lowest isoelectric point:
>tr|A0A1I6MWG7|A0A1I6MWG7_9RHOB Predicted ATP-dependent endonuclease of the OLD family contains P-loop ATPase and TOPRIM domains OS=Yoonia litorea OX=1123755 GN=SAMN05444714_2463 PE=4 SV=1
MM1 pKa = 7.67KK2 pKa = 9.35NTTYY6 pKa = 10.8LPAVAGFALIATGAVADD23 pKa = 3.79GHH25 pKa = 6.87APVLQVYY32 pKa = 8.54TYY34 pKa = 11.51DD35 pKa = 4.26SFTSDD40 pKa = 3.38WGPGPAIEE48 pKa = 4.34AAFEE52 pKa = 4.13EE53 pKa = 5.08TCACDD58 pKa = 3.68LQFVGAGDD66 pKa = 4.08GAALLARR73 pKa = 11.84LQLEE77 pKa = 4.77GPRR80 pKa = 11.84TDD82 pKa = 3.49ADD84 pKa = 3.37IVLGLDD90 pKa = 3.53TNLTAAARR98 pKa = 11.84EE99 pKa = 4.1TGLFAPHH106 pKa = 6.23GVEE109 pKa = 5.43ADD111 pKa = 3.66LDD113 pKa = 4.35LPIAWTDD120 pKa = 3.38PDD122 pKa = 4.68FLPFDD127 pKa = 3.21WGYY130 pKa = 10.13FAFVANADD138 pKa = 3.53AAAPASLTEE147 pKa = 4.44LAASDD152 pKa = 3.81TSIVIQDD159 pKa = 4.12PRR161 pKa = 11.84SSTPGLGLLMWVKK174 pKa = 10.36AAYY177 pKa = 10.09GDD179 pKa = 4.32DD180 pKa = 3.93AAQVWADD187 pKa = 3.47LADD190 pKa = 4.45NIVTVTPGWSEE201 pKa = 4.05AYY203 pKa = 10.55GMFLEE208 pKa = 5.24GEE210 pKa = 4.06ADD212 pKa = 3.44AVLSYY217 pKa = 7.6TTSPAYY223 pKa = 10.24HH224 pKa = 7.19LIAEE228 pKa = 4.35EE229 pKa = 4.36DD230 pKa = 3.49ASKK233 pKa = 10.95VAWAFDD239 pKa = 3.57EE240 pKa = 4.12GHH242 pKa = 5.58YY243 pKa = 9.52MQVEE247 pKa = 4.5VAGKK251 pKa = 10.04VATTDD256 pKa = 3.42QPEE259 pKa = 4.16LADD262 pKa = 3.39QFLAFMVTDD271 pKa = 4.66AFQSVIPTTNWMYY284 pKa = 9.99PAVVPVEE291 pKa = 3.9GLPAGFEE298 pKa = 4.24TLVTPEE304 pKa = 4.33ASLLLSPEE312 pKa = 3.83EE313 pKa = 4.05AASVRR318 pKa = 11.84DD319 pKa = 3.47AALDD323 pKa = 3.32EE324 pKa = 4.21WRR326 pKa = 11.84NALSQQ331 pKa = 3.37
MM1 pKa = 7.67KK2 pKa = 9.35NTTYY6 pKa = 10.8LPAVAGFALIATGAVADD23 pKa = 3.79GHH25 pKa = 6.87APVLQVYY32 pKa = 8.54TYY34 pKa = 11.51DD35 pKa = 4.26SFTSDD40 pKa = 3.38WGPGPAIEE48 pKa = 4.34AAFEE52 pKa = 4.13EE53 pKa = 5.08TCACDD58 pKa = 3.68LQFVGAGDD66 pKa = 4.08GAALLARR73 pKa = 11.84LQLEE77 pKa = 4.77GPRR80 pKa = 11.84TDD82 pKa = 3.49ADD84 pKa = 3.37IVLGLDD90 pKa = 3.53TNLTAAARR98 pKa = 11.84EE99 pKa = 4.1TGLFAPHH106 pKa = 6.23GVEE109 pKa = 5.43ADD111 pKa = 3.66LDD113 pKa = 4.35LPIAWTDD120 pKa = 3.38PDD122 pKa = 4.68FLPFDD127 pKa = 3.21WGYY130 pKa = 10.13FAFVANADD138 pKa = 3.53AAAPASLTEE147 pKa = 4.44LAASDD152 pKa = 3.81TSIVIQDD159 pKa = 4.12PRR161 pKa = 11.84SSTPGLGLLMWVKK174 pKa = 10.36AAYY177 pKa = 10.09GDD179 pKa = 4.32DD180 pKa = 3.93AAQVWADD187 pKa = 3.47LADD190 pKa = 4.45NIVTVTPGWSEE201 pKa = 4.05AYY203 pKa = 10.55GMFLEE208 pKa = 5.24GEE210 pKa = 4.06ADD212 pKa = 3.44AVLSYY217 pKa = 7.6TTSPAYY223 pKa = 10.24HH224 pKa = 7.19LIAEE228 pKa = 4.35EE229 pKa = 4.36DD230 pKa = 3.49ASKK233 pKa = 10.95VAWAFDD239 pKa = 3.57EE240 pKa = 4.12GHH242 pKa = 5.58YY243 pKa = 9.52MQVEE247 pKa = 4.5VAGKK251 pKa = 10.04VATTDD256 pKa = 3.42QPEE259 pKa = 4.16LADD262 pKa = 3.39QFLAFMVTDD271 pKa = 4.66AFQSVIPTTNWMYY284 pKa = 9.99PAVVPVEE291 pKa = 3.9GLPAGFEE298 pKa = 4.24TLVTPEE304 pKa = 4.33ASLLLSPEE312 pKa = 3.83EE313 pKa = 4.05AASVRR318 pKa = 11.84DD319 pKa = 3.47AALDD323 pKa = 3.32EE324 pKa = 4.21WRR326 pKa = 11.84NALSQQ331 pKa = 3.37
Molecular weight: 35.05 kDa
Isoelectric point according different methods:
Protein with the highest isoelectric point:
>tr|A0A1I6MZG7|A0A1I6MZG7_9RHOB Exodeoxyribonuclease III OS=Yoonia litorea OX=1123755 GN=SAMN05444714_2740 PE=3 SV=1
MM1 pKa = 7.45KK2 pKa = 9.61RR3 pKa = 11.84TFQPSNRR10 pKa = 11.84VRR12 pKa = 11.84KK13 pKa = 8.99NRR15 pKa = 11.84HH16 pKa = 3.77GFRR19 pKa = 11.84ARR21 pKa = 11.84MATKK25 pKa = 10.27SGRR28 pKa = 11.84KK29 pKa = 8.85IINARR34 pKa = 11.84RR35 pKa = 11.84AKK37 pKa = 10.31GRR39 pKa = 11.84AKK41 pKa = 10.69LSAA44 pKa = 3.92
MM1 pKa = 7.45KK2 pKa = 9.61RR3 pKa = 11.84TFQPSNRR10 pKa = 11.84VRR12 pKa = 11.84KK13 pKa = 8.99NRR15 pKa = 11.84HH16 pKa = 3.77GFRR19 pKa = 11.84ARR21 pKa = 11.84MATKK25 pKa = 10.27SGRR28 pKa = 11.84KK29 pKa = 8.85IINARR34 pKa = 11.84RR35 pKa = 11.84AKK37 pKa = 10.31GRR39 pKa = 11.84AKK41 pKa = 10.69LSAA44 pKa = 3.92
Molecular weight: 5.11 kDa
Isoelectric point according different methods:
Peptides (in silico digests for buttom-up proteomics)
Below you can find in silico digests of the whole proteome with Trypsin, Chymotrypsin, Trypsin+LysC, LysN, ArgC proteases suitable for different mass spec machines.| Try ESI |
 |
|---|
| ChTry ESI |
 |
|---|
| ArgC ESI |
 |
|---|
| LysN ESI |
 |
|---|
| TryLysC ESI |
 |
|---|
| Try MALDI |
 |
|---|
| ChTry MALDI |
 |
|---|
| ArgC MALDI |
 |
|---|
| LysN MALDI |
 |
|---|
| TryLysC MALDI |
 |
|---|
| Try LTQ |
 |
|---|
| ChTry LTQ |
 |
|---|
| ArgC LTQ |
 |
|---|
| LysN LTQ |
 |
|---|
| TryLysC LTQ |
 |
|---|
| Try MSlow |
 |
|---|
| ChTry MSlow |
 |
|---|
| ArgC MSlow |
 |
|---|
| LysN MSlow |
 |
|---|
| TryLysC MSlow |
 |
|---|
| Try MShigh |
 |
|---|
| ChTry MShigh |
 |
|---|
| ArgC MShigh |
 |
|---|
| LysN MShigh |
 |
|---|
| TryLysC MShigh |
 |
|---|
General Statistics
Number of major isoforms |
Number of additional isoforms |
Number of all proteins |
Number of amino acids |
Min. Seq. Length |
Max. Seq. Length |
Avg. Seq. Length |
Avg. Mol. Weight |
|---|---|---|---|---|---|---|---|
0 |
1020791 |
29 |
7024 |
310.0 |
33.69 |
Amino acid frequency
Ala |
Cys |
Asp |
Glu |
Phe |
Gly |
His |
Ile |
Lys |
Leu |
|---|---|---|---|---|---|---|---|---|---|
11.986 ± 0.057 | 0.86 ± 0.015 |
6.363 ± 0.05 | 5.894 ± 0.052 |
3.887 ± 0.035 | 8.506 ± 0.049 |
1.997 ± 0.027 | 5.538 ± 0.033 |
3.385 ± 0.041 | 9.707 ± 0.044 |
Met |
Asn |
Gln |
Pro |
Arg |
Ser |
Thr |
Val |
Trp |
Tyr |
|---|---|---|---|---|---|---|---|---|---|
2.813 ± 0.029 | 2.797 ± 0.028 |
4.852 ± 0.033 | 3.319 ± 0.022 |
6.206 ± 0.048 | 5.205 ± 0.031 |
5.669 ± 0.047 | 7.36 ± 0.036 |
1.393 ± 0.021 | 2.262 ± 0.022 |
Most of the basic statistics you can see at this page can be downloaded from this CSV file
Proteome-pI is available under Creative Commons Attribution-NoDerivs license, for more details see here
| Reference: Kozlowski LP. Proteome-pI 2.0: Proteome Isoelectric Point Database Update. Nucleic Acids Res. 2021, doi: 10.1093/nar/gkab944 | Contact: Lukasz P. Kozlowski |
