Pea necrotic yellow dwarf virus
Taxonomy: Viruses; Monodnaviria; Shotokuvirae; Cressdnaviricota; Arfiviricetes; Mulpavirales; Nanoviridae; Nanovirus
Average proteome isoelectric point is 6.56
Get precalculated fractions of proteins

Virtual 2D-PAGE plot for 8 proteins (isoelectric point calculated using IPC2_protein)
Get csv file with sequences according to given criteria:
* You can choose from 21 different methods for calculating isoelectric point
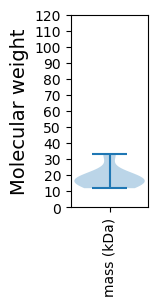
Summary statistics related to proteome-wise predictions


Protein with the lowest isoelectric point:
>tr|I6QEN9|I6QEN9_9VIRU Capsid protein OS=Pea necrotic yellow dwarf virus OX=753670 GN=CP PE=3 SV=1
MM1 pKa = 7.43EE2 pKa = 4.58RR3 pKa = 11.84RR4 pKa = 11.84FIFFFLLVLTVLNSSFVMNLILGYY28 pKa = 10.3VLGVLLVKK36 pKa = 10.55NIPGLRR42 pKa = 11.84AMLVGEE48 pKa = 4.47RR49 pKa = 11.84DD50 pKa = 3.66VEE52 pKa = 4.34IKK54 pKa = 10.72SEE56 pKa = 4.27DD57 pKa = 3.38DD58 pKa = 3.51TFVEE62 pKa = 5.69GVAEE66 pKa = 4.41DD67 pKa = 3.81VRR69 pKa = 11.84DD70 pKa = 3.78HH71 pKa = 6.98LKK73 pKa = 9.46TLGLDD78 pKa = 3.48VKK80 pKa = 11.45VEE82 pKa = 4.15GEE84 pKa = 4.02DD85 pKa = 4.25LEE87 pKa = 4.51YY88 pKa = 10.95LQSLWKK94 pKa = 9.97EE95 pKa = 4.19LRR97 pKa = 11.84NHH99 pKa = 6.41AVNMM103 pKa = 4.2
MM1 pKa = 7.43EE2 pKa = 4.58RR3 pKa = 11.84RR4 pKa = 11.84FIFFFLLVLTVLNSSFVMNLILGYY28 pKa = 10.3VLGVLLVKK36 pKa = 10.55NIPGLRR42 pKa = 11.84AMLVGEE48 pKa = 4.47RR49 pKa = 11.84DD50 pKa = 3.66VEE52 pKa = 4.34IKK54 pKa = 10.72SEE56 pKa = 4.27DD57 pKa = 3.38DD58 pKa = 3.51TFVEE62 pKa = 5.69GVAEE66 pKa = 4.41DD67 pKa = 3.81VRR69 pKa = 11.84DD70 pKa = 3.78HH71 pKa = 6.98LKK73 pKa = 9.46TLGLDD78 pKa = 3.48VKK80 pKa = 11.45VEE82 pKa = 4.15GEE84 pKa = 4.02DD85 pKa = 4.25LEE87 pKa = 4.51YY88 pKa = 10.95LQSLWKK94 pKa = 9.97EE95 pKa = 4.19LRR97 pKa = 11.84NHH99 pKa = 6.41AVNMM103 pKa = 4.2
Molecular weight: 11.82 kDa
Isoelectric point according different methods:
Protein with the highest isoelectric point:
>tr|I6QEP0|I6QEP0_9VIRU U2 protein OS=Pea necrotic yellow dwarf virus OX=753670 GN=U2 PE=4 SV=1
MM1 pKa = 7.67APFAQWAVKK10 pKa = 9.9KK11 pKa = 10.47RR12 pKa = 11.84RR13 pKa = 11.84TPRR16 pKa = 11.84GGARR20 pKa = 11.84RR21 pKa = 11.84YY22 pKa = 9.92SKK24 pKa = 11.01AVAPTTKK31 pKa = 10.28VAFHH35 pKa = 6.34QSTVLNKK42 pKa = 9.58EE43 pKa = 4.3DD44 pKa = 3.34IVGFEE49 pKa = 4.63IKK51 pKa = 10.42PPDD54 pKa = 3.0ITRR57 pKa = 11.84YY58 pKa = 8.89KK59 pKa = 9.55IRR61 pKa = 11.84RR62 pKa = 11.84VVLFCTFRR70 pKa = 11.84MPPGEE75 pKa = 4.2LLNYY79 pKa = 10.26LIVKK83 pKa = 8.02TNSPLLNWGAVFTAPGLMVKK103 pKa = 9.75EE104 pKa = 4.37QFQDD108 pKa = 2.81MVTIVTGGKK117 pKa = 10.02LEE119 pKa = 4.2GSGVAGSTSLKK130 pKa = 10.75AMRR133 pKa = 11.84KK134 pKa = 8.53VVNLGAGVAQTQHH147 pKa = 5.64MYY149 pKa = 10.68VVFFSSDD156 pKa = 2.85SMKK159 pKa = 10.76AILEE163 pKa = 4.04GRR165 pKa = 11.84VYY167 pKa = 10.88VAII170 pKa = 4.69
MM1 pKa = 7.67APFAQWAVKK10 pKa = 9.9KK11 pKa = 10.47RR12 pKa = 11.84RR13 pKa = 11.84TPRR16 pKa = 11.84GGARR20 pKa = 11.84RR21 pKa = 11.84YY22 pKa = 9.92SKK24 pKa = 11.01AVAPTTKK31 pKa = 10.28VAFHH35 pKa = 6.34QSTVLNKK42 pKa = 9.58EE43 pKa = 4.3DD44 pKa = 3.34IVGFEE49 pKa = 4.63IKK51 pKa = 10.42PPDD54 pKa = 3.0ITRR57 pKa = 11.84YY58 pKa = 8.89KK59 pKa = 9.55IRR61 pKa = 11.84RR62 pKa = 11.84VVLFCTFRR70 pKa = 11.84MPPGEE75 pKa = 4.2LLNYY79 pKa = 10.26LIVKK83 pKa = 8.02TNSPLLNWGAVFTAPGLMVKK103 pKa = 9.75EE104 pKa = 4.37QFQDD108 pKa = 2.81MVTIVTGGKK117 pKa = 10.02LEE119 pKa = 4.2GSGVAGSTSLKK130 pKa = 10.75AMRR133 pKa = 11.84KK134 pKa = 8.53VVNLGAGVAQTQHH147 pKa = 5.64MYY149 pKa = 10.68VVFFSSDD156 pKa = 2.85SMKK159 pKa = 10.76AILEE163 pKa = 4.04GRR165 pKa = 11.84VYY167 pKa = 10.88VAII170 pKa = 4.69
Molecular weight: 18.77 kDa
Isoelectric point according different methods:
Peptides (in silico digests for buttom-up proteomics)
Below you can find in silico digests of the whole proteome with Trypsin, Chymotrypsin, Trypsin+LysC, LysN, ArgC proteases suitable for different mass spec machines.| Try ESI |
 |
|---|
| ChTry ESI |
 |
|---|
| ArgC ESI |
 |
|---|
| LysN ESI |
 |
|---|
| TryLysC ESI |
 |
|---|
| Try MALDI |
 |
|---|
| ChTry MALDI |
 |
|---|
| ArgC MALDI |
 |
|---|
| LysN MALDI |
 |
|---|
| TryLysC MALDI |
 |
|---|
| Try LTQ |
 |
|---|
| ChTry LTQ |
 |
|---|
| ArgC LTQ |
 |
|---|
| LysN LTQ |
 |
|---|
| TryLysC LTQ |
 |
|---|
| Try MSlow |
 |
|---|
| ChTry MSlow |
 |
|---|
| ArgC MSlow |
 |
|---|
| LysN MSlow |
 |
|---|
| TryLysC MSlow |
 |
|---|
| Try MShigh |
 |
|---|
| ChTry MShigh |
 |
|---|
| ArgC MShigh |
 |
|---|
| LysN MShigh |
 |
|---|
| TryLysC MShigh |
 |
|---|
General Statistics
Number of major isoforms |
Number of additional isoforms |
Number of all proteins |
Number of amino acids |
Min. Seq. Length |
Max. Seq. Length |
Avg. Seq. Length |
Avg. Mol. Weight |
|---|---|---|---|---|---|---|---|
0 |
1272 |
103 |
286 |
159.0 |
18.27 |
Amino acid frequency
Ala |
Cys |
Asp |
Glu |
Phe |
Gly |
His |
Ile |
Lys |
Leu |
|---|---|---|---|---|---|---|---|---|---|
4.088 ± 0.782 | 1.965 ± 0.369 |
5.346 ± 0.657 | 7.469 ± 0.954 |
4.874 ± 0.423 | 6.997 ± 0.586 |
1.808 ± 0.258 | 6.604 ± 0.757 |
6.053 ± 0.513 | 8.648 ± 0.972 |
Met |
Asn |
Gln |
Pro |
Arg |
Ser |
Thr |
Val |
Trp |
Tyr |
|---|---|---|---|---|---|---|---|---|---|
3.852 ± 0.216 | 3.616 ± 0.344 |
3.774 ± 0.557 | 3.223 ± 0.404 |
7.154 ± 0.626 | 6.84 ± 0.708 |
4.403 ± 0.46 | 8.019 ± 0.948 |
1.415 ± 0.307 | 3.852 ± 0.459 |
Most of the basic statistics you can see at this page can be downloaded from this CSV file
Proteome-pI is available under Creative Commons Attribution-NoDerivs license, for more details see here
| Reference: Kozlowski LP. Proteome-pI 2.0: Proteome Isoelectric Point Database Update. Nucleic Acids Res. 2021, doi: 10.1093/nar/gkab944 | Contact: Lukasz P. Kozlowski |
