Lettuce virus X
Taxonomy: Viruses; Riboviria; Orthornavirae; Kitrinoviricota; Alsuviricetes; Tymovirales; Alphaflexiviridae; Potexvirus
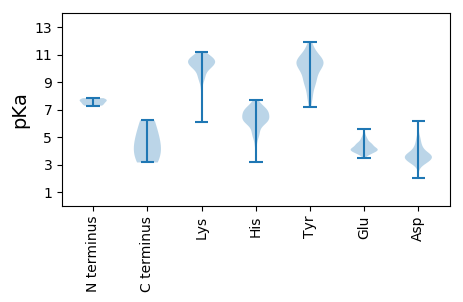
Average proteome isoelectric point is 7.0
Get precalculated fractions of proteins

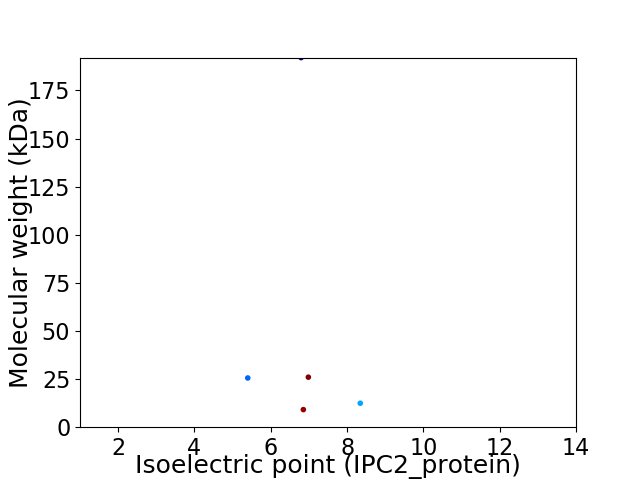
Virtual 2D-PAGE plot for 5 proteins (isoelectric point calculated using IPC2_protein)
Get csv file with sequences according to given criteria:
* You can choose from 21 different methods for calculating isoelectric point
Summary statistics related to proteome-wise predictions


Protein with the lowest isoelectric point:
>tr|B3CJG4|B3CJG4_9VIRU Triple-gene-block-protein 2 OS=Lettuce virus X OX=447171 GN=TGBp2 PE=4 SV=1
MM1 pKa = 7.65AVPLLHH7 pKa = 7.29KK8 pKa = 10.64LLLEE12 pKa = 4.33NEE14 pKa = 4.57FQRR17 pKa = 11.84TATPLSYY24 pKa = 10.36PIIIFGTAGSGKK36 pKa = 6.1TTIIRR41 pKa = 11.84LLAAAYY47 pKa = 8.09PDD49 pKa = 3.62LHH51 pKa = 6.42FSSFRR56 pKa = 11.84PCLLLPNTRR65 pKa = 11.84RR66 pKa = 11.84SQVAANPLTPTDD78 pKa = 3.66VLDD81 pKa = 4.22EE82 pKa = 4.45FLAGPNPAVSLAKK95 pKa = 10.52FCDD98 pKa = 3.64PLQYY102 pKa = 11.22NCTDD106 pKa = 3.79LPLPHH111 pKa = 6.21YY112 pKa = 8.73TSNHH116 pKa = 5.0TYY118 pKa = 9.65RR119 pKa = 11.84FCPATCDD126 pKa = 4.18LLNQLFSTTLSSRR139 pKa = 11.84LPTAASITRR148 pKa = 11.84PDD150 pKa = 4.89PYY152 pKa = 11.09SQDD155 pKa = 3.23PSGTVVALEE164 pKa = 3.86QDD166 pKa = 3.54LLDD169 pKa = 3.64ILKK172 pKa = 9.58QHH174 pKa = 6.34GAFPKK179 pKa = 10.49KK180 pKa = 9.63PAEE183 pKa = 4.13LTGQTLPAVAFYY195 pKa = 10.78CSSLQDD201 pKa = 4.5AYY203 pKa = 10.99DD204 pKa = 4.47ADD206 pKa = 4.04PAATFIALTRR216 pKa = 11.84HH217 pKa = 4.4TTKK220 pKa = 11.09LEE222 pKa = 3.67IFEE225 pKa = 4.95LDD227 pKa = 3.42ARR229 pKa = 11.84PDD231 pKa = 3.43PTAA234 pKa = 4.44
MM1 pKa = 7.65AVPLLHH7 pKa = 7.29KK8 pKa = 10.64LLLEE12 pKa = 4.33NEE14 pKa = 4.57FQRR17 pKa = 11.84TATPLSYY24 pKa = 10.36PIIIFGTAGSGKK36 pKa = 6.1TTIIRR41 pKa = 11.84LLAAAYY47 pKa = 8.09PDD49 pKa = 3.62LHH51 pKa = 6.42FSSFRR56 pKa = 11.84PCLLLPNTRR65 pKa = 11.84RR66 pKa = 11.84SQVAANPLTPTDD78 pKa = 3.66VLDD81 pKa = 4.22EE82 pKa = 4.45FLAGPNPAVSLAKK95 pKa = 10.52FCDD98 pKa = 3.64PLQYY102 pKa = 11.22NCTDD106 pKa = 3.79LPLPHH111 pKa = 6.21YY112 pKa = 8.73TSNHH116 pKa = 5.0TYY118 pKa = 9.65RR119 pKa = 11.84FCPATCDD126 pKa = 4.18LLNQLFSTTLSSRR139 pKa = 11.84LPTAASITRR148 pKa = 11.84PDD150 pKa = 4.89PYY152 pKa = 11.09SQDD155 pKa = 3.23PSGTVVALEE164 pKa = 3.86QDD166 pKa = 3.54LLDD169 pKa = 3.64ILKK172 pKa = 9.58QHH174 pKa = 6.34GAFPKK179 pKa = 10.49KK180 pKa = 9.63PAEE183 pKa = 4.13LTGQTLPAVAFYY195 pKa = 10.78CSSLQDD201 pKa = 4.5AYY203 pKa = 10.99DD204 pKa = 4.47ADD206 pKa = 4.04PAATFIALTRR216 pKa = 11.84HH217 pKa = 4.4TTKK220 pKa = 11.09LEE222 pKa = 3.67IFEE225 pKa = 4.95LDD227 pKa = 3.42ARR229 pKa = 11.84PDD231 pKa = 3.43PTAA234 pKa = 4.44
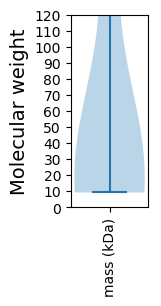
Molecular weight: 25.57 kDa
Isoelectric point according different methods:
Protein with the highest isoelectric point:
>tr|B3CJG5|B3CJG5_9VIRU Movement protein TGBp3 OS=Lettuce virus X OX=447171 GN=TGBp3 PE=3 SV=1
MM1 pKa = 7.83PGLTPPPNHH10 pKa = 6.06EE11 pKa = 4.05HH12 pKa = 6.12TFQIIAIGFLCCGIIYY28 pKa = 10.38ALRR31 pKa = 11.84TNHH34 pKa = 6.59APHH37 pKa = 6.87TGDD40 pKa = 3.49QQHH43 pKa = 6.28SLPFGGHH50 pKa = 4.91YY51 pKa = 9.95QDD53 pKa = 3.09GTKK56 pKa = 10.02RR57 pKa = 11.84VIYY60 pKa = 10.01NSPSYY65 pKa = 11.06PNVRR69 pKa = 11.84CSKK72 pKa = 10.35LLALAAILGLSAFILGNQWYY92 pKa = 9.55SRR94 pKa = 11.84RR95 pKa = 11.84SVTRR99 pKa = 11.84IHH101 pKa = 6.15TCVHH105 pKa = 6.78CSNVPPSLL113 pKa = 3.68
MM1 pKa = 7.83PGLTPPPNHH10 pKa = 6.06EE11 pKa = 4.05HH12 pKa = 6.12TFQIIAIGFLCCGIIYY28 pKa = 10.38ALRR31 pKa = 11.84TNHH34 pKa = 6.59APHH37 pKa = 6.87TGDD40 pKa = 3.49QQHH43 pKa = 6.28SLPFGGHH50 pKa = 4.91YY51 pKa = 9.95QDD53 pKa = 3.09GTKK56 pKa = 10.02RR57 pKa = 11.84VIYY60 pKa = 10.01NSPSYY65 pKa = 11.06PNVRR69 pKa = 11.84CSKK72 pKa = 10.35LLALAAILGLSAFILGNQWYY92 pKa = 9.55SRR94 pKa = 11.84RR95 pKa = 11.84SVTRR99 pKa = 11.84IHH101 pKa = 6.15TCVHH105 pKa = 6.78CSNVPPSLL113 pKa = 3.68
Molecular weight: 12.46 kDa
Isoelectric point according different methods:
Peptides (in silico digests for buttom-up proteomics)
Below you can find in silico digests of the whole proteome with Trypsin, Chymotrypsin, Trypsin+LysC, LysN, ArgC proteases suitable for different mass spec machines.| Try ESI |
 |
|---|
| ChTry ESI |
 |
|---|
| ArgC ESI |
 |
|---|
| LysN ESI |
 |
|---|
| TryLysC ESI |
 |
|---|
| Try MALDI |
 |
|---|
| ChTry MALDI |
 |
|---|
| ArgC MALDI |
 |
|---|
| LysN MALDI |
 |
|---|
| TryLysC MALDI |
 |
|---|
| Try LTQ |
 |
|---|
| ChTry LTQ |
 |
|---|
| ArgC LTQ |
 |
|---|
| LysN LTQ |
 |
|---|
| TryLysC LTQ |
 |
|---|
| Try MSlow |
 |
|---|
| ChTry MSlow |
 |
|---|
| ArgC MSlow |
 |
|---|
| LysN MSlow |
 |
|---|
| TryLysC MSlow |
 |
|---|
| Try MShigh |
 |
|---|
| ChTry MShigh |
 |
|---|
| ArgC MShigh |
 |
|---|
| LysN MShigh |
 |
|---|
| TryLysC MShigh |
 |
|---|
General Statistics
Number of major isoforms |
Number of additional isoforms |
Number of all proteins |
Number of amino acids |
Min. Seq. Length |
Max. Seq. Length |
Avg. Seq. Length |
Avg. Mol. Weight |
|---|---|---|---|---|---|---|---|
0 |
2381 |
84 |
1708 |
476.2 |
53.05 |
Amino acid frequency
Ala |
Cys |
Asp |
Glu |
Phe |
Gly |
His |
Ile |
Lys |
Leu |
|---|---|---|---|---|---|---|---|---|---|
9.03 ± 1.134 | 1.428 ± 0.649 |
5.124 ± 0.337 | 4.704 ± 1.172 |
4.746 ± 0.343 | 4.662 ± 0.445 |
3.36 ± 0.558 | 4.284 ± 0.501 |
4.746 ± 1.196 | 9.366 ± 1.122 |
Met |
Asn |
Gln |
Pro |
Arg |
Ser |
Thr |
Val |
Trp |
Tyr |
|---|---|---|---|---|---|---|---|---|---|
2.016 ± 0.437 | 4.62 ± 0.357 |
8.19 ± 0.835 | 4.116 ± 0.265 |
5.124 ± 0.192 | 6.888 ± 0.681 |
7.686 ± 0.771 | 5.67 ± 0.639 |
1.134 ± 0.356 | 3.108 ± 0.237 |
Most of the basic statistics you can see at this page can be downloaded from this CSV file
Proteome-pI is available under Creative Commons Attribution-NoDerivs license, for more details see here
| Reference: Kozlowski LP. Proteome-pI 2.0: Proteome Isoelectric Point Database Update. Nucleic Acids Res. 2021, doi: 10.1093/nar/gkab944 | Contact: Lukasz P. Kozlowski |
