Streptococcus satellite phage Javan752
Taxonomy: Viruses; unclassified bacterial viruses
Average proteome isoelectric point is 6.68
Get precalculated fractions of proteins

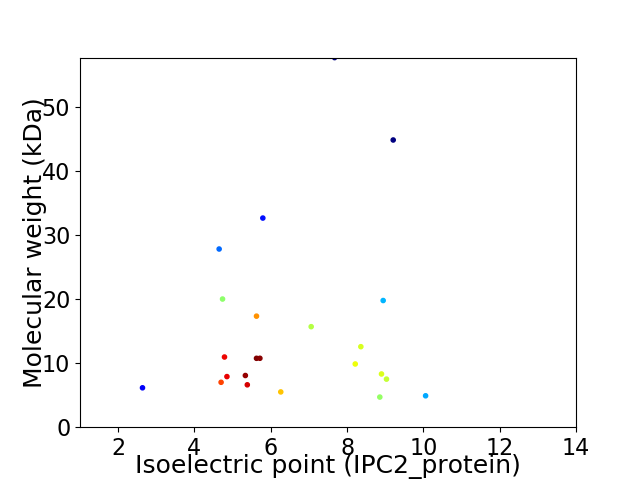
Virtual 2D-PAGE plot for 23 proteins (isoelectric point calculated using IPC2_protein)
Get csv file with sequences according to given criteria:
* You can choose from 21 different methods for calculating isoelectric point
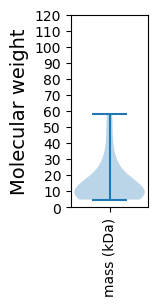
Summary statistics related to proteome-wise predictions


Protein with the lowest isoelectric point:
>tr|A0A4D6A0I8|A0A4D6A0I8_9VIRU Uncharacterized protein OS=Streptococcus satellite phage Javan752 OX=2558847 GN=JavanS752_0014 PE=4 SV=1
MM1 pKa = 8.09DD2 pKa = 5.18NLAQHH7 pKa = 6.11VGEE10 pKa = 4.66KK11 pKa = 10.18IKK13 pKa = 10.56FFRR16 pKa = 11.84KK17 pKa = 9.17EE18 pKa = 3.97NGWTQSVLAEE28 pKa = 4.2KK29 pKa = 10.27MSTSKK34 pKa = 8.64QTISKK39 pKa = 9.22YY40 pKa = 9.45EE41 pKa = 3.68KK42 pKa = 10.78GIIKK46 pKa = 10.09VNQDD50 pKa = 4.02TIFKK54 pKa = 9.93LADD57 pKa = 3.16IFGVSIDD64 pKa = 3.96SFFPSIIEE72 pKa = 4.48EE73 pKa = 4.11IATTSPIQSIYY84 pKa = 10.88DD85 pKa = 3.27QLTPPRR91 pKa = 11.84QEE93 pKa = 3.78KK94 pKa = 10.64ALTYY98 pKa = 10.35LKK100 pKa = 10.55KK101 pKa = 10.37QLLEE105 pKa = 4.02QKK107 pKa = 10.32NEE109 pKa = 4.21NIVSEE114 pKa = 4.5NIISLDD120 pKa = 3.66DD121 pKa = 3.6YY122 pKa = 11.31RR123 pKa = 11.84EE124 pKa = 4.27SKK126 pKa = 8.86TLPVIGVVTAGNGITQDD143 pKa = 4.14DD144 pKa = 4.47NLNMEE149 pKa = 4.13KK150 pKa = 10.39CFYY153 pKa = 10.23TDD155 pKa = 5.38EE156 pKa = 5.49IPDD159 pKa = 4.38DD160 pKa = 4.3YY161 pKa = 11.82DD162 pKa = 5.57AIAYY166 pKa = 8.54VVGNSMEE173 pKa = 4.18PKK175 pKa = 9.97IKK177 pKa = 10.88NGDD180 pKa = 3.4YY181 pKa = 11.13LFIKK185 pKa = 8.35NTPQVDD191 pKa = 3.97YY192 pKa = 8.82NTIGIFQVDD201 pKa = 3.58GANYY205 pKa = 9.54VKK207 pKa = 10.81KK208 pKa = 10.47LRR210 pKa = 11.84QGYY213 pKa = 9.62LEE215 pKa = 4.22SLNPEE220 pKa = 4.27CADD223 pKa = 3.24IQLDD227 pKa = 3.77EE228 pKa = 5.74DD229 pKa = 3.79NDD231 pKa = 3.21IRR233 pKa = 11.84TIGEE237 pKa = 3.96VVSIYY242 pKa = 10.26RR243 pKa = 11.84EE244 pKa = 3.91KK245 pKa = 11.19
MM1 pKa = 8.09DD2 pKa = 5.18NLAQHH7 pKa = 6.11VGEE10 pKa = 4.66KK11 pKa = 10.18IKK13 pKa = 10.56FFRR16 pKa = 11.84KK17 pKa = 9.17EE18 pKa = 3.97NGWTQSVLAEE28 pKa = 4.2KK29 pKa = 10.27MSTSKK34 pKa = 8.64QTISKK39 pKa = 9.22YY40 pKa = 9.45EE41 pKa = 3.68KK42 pKa = 10.78GIIKK46 pKa = 10.09VNQDD50 pKa = 4.02TIFKK54 pKa = 9.93LADD57 pKa = 3.16IFGVSIDD64 pKa = 3.96SFFPSIIEE72 pKa = 4.48EE73 pKa = 4.11IATTSPIQSIYY84 pKa = 10.88DD85 pKa = 3.27QLTPPRR91 pKa = 11.84QEE93 pKa = 3.78KK94 pKa = 10.64ALTYY98 pKa = 10.35LKK100 pKa = 10.55KK101 pKa = 10.37QLLEE105 pKa = 4.02QKK107 pKa = 10.32NEE109 pKa = 4.21NIVSEE114 pKa = 4.5NIISLDD120 pKa = 3.66DD121 pKa = 3.6YY122 pKa = 11.31RR123 pKa = 11.84EE124 pKa = 4.27SKK126 pKa = 8.86TLPVIGVVTAGNGITQDD143 pKa = 4.14DD144 pKa = 4.47NLNMEE149 pKa = 4.13KK150 pKa = 10.39CFYY153 pKa = 10.23TDD155 pKa = 5.38EE156 pKa = 5.49IPDD159 pKa = 4.38DD160 pKa = 4.3YY161 pKa = 11.82DD162 pKa = 5.57AIAYY166 pKa = 8.54VVGNSMEE173 pKa = 4.18PKK175 pKa = 9.97IKK177 pKa = 10.88NGDD180 pKa = 3.4YY181 pKa = 11.13LFIKK185 pKa = 8.35NTPQVDD191 pKa = 3.97YY192 pKa = 8.82NTIGIFQVDD201 pKa = 3.58GANYY205 pKa = 9.54VKK207 pKa = 10.81KK208 pKa = 10.47LRR210 pKa = 11.84QGYY213 pKa = 9.62LEE215 pKa = 4.22SLNPEE220 pKa = 4.27CADD223 pKa = 3.24IQLDD227 pKa = 3.77EE228 pKa = 5.74DD229 pKa = 3.79NDD231 pKa = 3.21IRR233 pKa = 11.84TIGEE237 pKa = 3.96VVSIYY242 pKa = 10.26RR243 pKa = 11.84EE244 pKa = 3.91KK245 pKa = 11.19
Molecular weight: 27.86 kDa
Isoelectric point according different methods:
Protein with the highest isoelectric point:
>tr|A0A4D5ZVP1|A0A4D5ZVP1_9VIRU Uncharacterized protein OS=Streptococcus satellite phage Javan752 OX=2558847 GN=JavanS752_0013 PE=4 SV=1
MM1 pKa = 7.25KK2 pKa = 10.36RR3 pKa = 11.84IATIFLLGLPKK14 pKa = 9.96VPKK17 pKa = 8.88MRR19 pKa = 11.84PIAYY23 pKa = 8.55PRR25 pKa = 11.84ATISNNPEE33 pKa = 3.14ARR35 pKa = 11.84GIYY38 pKa = 10.11LEE40 pKa = 4.06NKK42 pKa = 9.02KK43 pKa = 10.62
MM1 pKa = 7.25KK2 pKa = 10.36RR3 pKa = 11.84IATIFLLGLPKK14 pKa = 9.96VPKK17 pKa = 8.88MRR19 pKa = 11.84PIAYY23 pKa = 8.55PRR25 pKa = 11.84ATISNNPEE33 pKa = 3.14ARR35 pKa = 11.84GIYY38 pKa = 10.11LEE40 pKa = 4.06NKK42 pKa = 9.02KK43 pKa = 10.62
Molecular weight: 4.91 kDa
Isoelectric point according different methods:
Peptides (in silico digests for buttom-up proteomics)
Below you can find in silico digests of the whole proteome with Trypsin, Chymotrypsin, Trypsin+LysC, LysN, ArgC proteases suitable for different mass spec machines.| Try ESI |
 |
|---|
| ChTry ESI |
 |
|---|
| ArgC ESI |
 |
|---|
| LysN ESI |
 |
|---|
| TryLysC ESI |
 |
|---|
| Try MALDI |
 |
|---|
| ChTry MALDI |
 |
|---|
| ArgC MALDI |
 |
|---|
| LysN MALDI |
 |
|---|
| TryLysC MALDI |
 |
|---|
| Try LTQ |
 |
|---|
| ChTry LTQ |
 |
|---|
| ArgC LTQ |
 |
|---|
| LysN LTQ |
 |
|---|
| TryLysC LTQ |
 |
|---|
| Try MSlow |
 |
|---|
| ChTry MSlow |
 |
|---|
| ArgC MSlow |
 |
|---|
| LysN MSlow |
 |
|---|
| TryLysC MSlow |
 |
|---|
| Try MShigh |
 |
|---|
| ChTry MShigh |
 |
|---|
| ArgC MShigh |
 |
|---|
| LysN MShigh |
 |
|---|
| TryLysC MShigh |
 |
|---|
General Statistics
Number of major isoforms |
Number of additional isoforms |
Number of all proteins |
Number of amino acids |
Min. Seq. Length |
Max. Seq. Length |
Avg. Seq. Length |
Avg. Mol. Weight |
|---|---|---|---|---|---|---|---|
0 |
3089 |
40 |
496 |
134.3 |
15.56 |
Amino acid frequency
Ala |
Cys |
Asp |
Glu |
Phe |
Gly |
His |
Ile |
Lys |
Leu |
|---|---|---|---|---|---|---|---|---|---|
5.018 ± 0.402 | 1.036 ± 0.195 |
5.924 ± 0.455 | 8.514 ± 0.667 |
4.467 ± 0.259 | 5.277 ± 0.4 |
1.586 ± 0.26 | 7.219 ± 0.483 |
8.967 ± 0.549 | 9.938 ± 0.546 |
Met |
Asn |
Gln |
Pro |
Arg |
Ser |
Thr |
Val |
Trp |
Tyr |
|---|---|---|---|---|---|---|---|---|---|
2.719 ± 0.289 | 5.18 ± 0.428 |
3.432 ± 0.47 | 3.852 ± 0.326 |
5.698 ± 0.459 | 5.601 ± 0.31 |
5.244 ± 0.516 | 5.083 ± 0.489 |
0.906 ± 0.216 | 4.338 ± 0.352 |
Most of the basic statistics you can see at this page can be downloaded from this CSV file
Proteome-pI is available under Creative Commons Attribution-NoDerivs license, for more details see here
| Reference: Kozlowski LP. Proteome-pI 2.0: Proteome Isoelectric Point Database Update. Nucleic Acids Res. 2021, doi: 10.1093/nar/gkab944 | Contact: Lukasz P. Kozlowski |
