Inoviridae sp. ctBZ32
Taxonomy: Viruses; Monodnaviria; Loebvirae; Hofneiviricota; Faserviricetes; Tubulavirales; Inoviridae; unclassified Inoviridae
Average proteome isoelectric point is 7.73
Get precalculated fractions of proteins

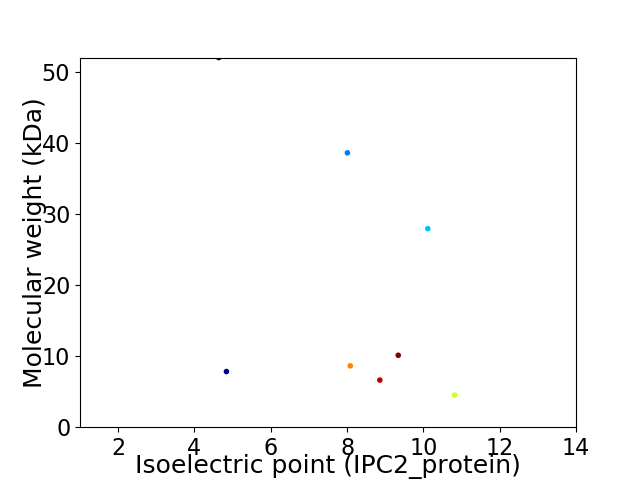
Virtual 2D-PAGE plot for 8 proteins (isoelectric point calculated using IPC2_protein)
Get csv file with sequences according to given criteria:
* You can choose from 21 different methods for calculating isoelectric point
Summary statistics related to proteome-wise predictions


Protein with the lowest isoelectric point:
>tr|A0A5Q2WB72|A0A5Q2WB72_9VIRU Head virion protein OS=Inoviridae sp. ctBZ32 OX=2656729 PE=4 SV=1
MM1 pKa = 7.14NRR3 pKa = 11.84DD4 pKa = 3.12RR5 pKa = 11.84VVLRR9 pKa = 11.84RR10 pKa = 11.84SSGGSVAHH18 pKa = 6.23LQRR21 pKa = 11.84VARR24 pKa = 11.84ALVGFIIGVCFAYY37 pKa = 10.32AAIVPAYY44 pKa = 9.03AQSIPATLNTQPSTPGVDD62 pKa = 3.31GFKK65 pKa = 10.9GGGVPNVQCRR75 pKa = 11.84TNKK78 pKa = 9.91YY79 pKa = 7.88QACIDD84 pKa = 3.73ADD86 pKa = 4.27SYY88 pKa = 11.57IGWTTLCFDD97 pKa = 4.31GGTVCRR103 pKa = 11.84NASGFTGDD111 pKa = 4.04RR112 pKa = 11.84TTQACEE118 pKa = 3.48TWRR121 pKa = 11.84GAVVTLTNCTTEE133 pKa = 4.16PSCPAGYY140 pKa = 8.14TLNGTTCQQYY150 pKa = 8.56TCPAGYY156 pKa = 8.19TLNGTMCDD164 pKa = 4.42PEE166 pKa = 4.9PEE168 pKa = 4.42PCPEE172 pKa = 3.85VGSFRR177 pKa = 11.84FDD179 pKa = 3.66NILTPRR185 pKa = 11.84TPVPNQAWPDD195 pKa = 3.42ARR197 pKa = 11.84TTCVDD202 pKa = 2.82GCLAMLRR209 pKa = 11.84AVSATPNAWVWSVQYY224 pKa = 11.11VDD226 pKa = 5.09GVGNPTGQCTGGISVGEE243 pKa = 4.32GPLGPDD249 pKa = 3.47TDD251 pKa = 4.17PATPEE256 pKa = 4.6DD257 pKa = 4.88DD258 pKa = 3.84PVEE261 pKa = 4.4PPTPEE266 pKa = 3.83DD267 pKa = 3.32AACIRR272 pKa = 11.84QGKK275 pKa = 8.89CPGVVNGQAVCMPCTSQPGGGSSTTTSGTTTNPDD309 pKa = 2.92GTTSTTEE316 pKa = 3.46RR317 pKa = 11.84RR318 pKa = 11.84TTTTCDD324 pKa = 2.84GGQCTTTTTTTTTTRR339 pKa = 11.84DD340 pKa = 3.42AQGNPTGTTTSTEE353 pKa = 4.03SRR355 pKa = 11.84TGPGTGPGSGGNGDD369 pKa = 3.37GDD371 pKa = 3.67GDD373 pKa = 3.82EE374 pKa = 5.0RR375 pKa = 11.84GSSFGGACAAGFACEE390 pKa = 4.86GDD392 pKa = 4.35AIQCAIARR400 pKa = 11.84EE401 pKa = 3.98QHH403 pKa = 5.93IKK405 pKa = 10.05NCRR408 pKa = 11.84FWEE411 pKa = 4.48SKK413 pKa = 10.84GGLSEE418 pKa = 4.32ADD420 pKa = 3.06AVKK423 pKa = 10.82AFDD426 pKa = 4.41DD427 pKa = 5.26ARR429 pKa = 11.84GTDD432 pKa = 3.41AKK434 pKa = 10.55KK435 pKa = 10.97LNAEE439 pKa = 3.85PVAFQNLEE447 pKa = 3.75RR448 pKa = 11.84TAFLGAGTLSDD459 pKa = 3.84VSFTVQGQTLSIPFSEE475 pKa = 4.88LVPFLQAMGLAFMAVCGVIAIGIIRR500 pKa = 11.84TGVAA504 pKa = 3.16
MM1 pKa = 7.14NRR3 pKa = 11.84DD4 pKa = 3.12RR5 pKa = 11.84VVLRR9 pKa = 11.84RR10 pKa = 11.84SSGGSVAHH18 pKa = 6.23LQRR21 pKa = 11.84VARR24 pKa = 11.84ALVGFIIGVCFAYY37 pKa = 10.32AAIVPAYY44 pKa = 9.03AQSIPATLNTQPSTPGVDD62 pKa = 3.31GFKK65 pKa = 10.9GGGVPNVQCRR75 pKa = 11.84TNKK78 pKa = 9.91YY79 pKa = 7.88QACIDD84 pKa = 3.73ADD86 pKa = 4.27SYY88 pKa = 11.57IGWTTLCFDD97 pKa = 4.31GGTVCRR103 pKa = 11.84NASGFTGDD111 pKa = 4.04RR112 pKa = 11.84TTQACEE118 pKa = 3.48TWRR121 pKa = 11.84GAVVTLTNCTTEE133 pKa = 4.16PSCPAGYY140 pKa = 8.14TLNGTTCQQYY150 pKa = 8.56TCPAGYY156 pKa = 8.19TLNGTMCDD164 pKa = 4.42PEE166 pKa = 4.9PEE168 pKa = 4.42PCPEE172 pKa = 3.85VGSFRR177 pKa = 11.84FDD179 pKa = 3.66NILTPRR185 pKa = 11.84TPVPNQAWPDD195 pKa = 3.42ARR197 pKa = 11.84TTCVDD202 pKa = 2.82GCLAMLRR209 pKa = 11.84AVSATPNAWVWSVQYY224 pKa = 11.11VDD226 pKa = 5.09GVGNPTGQCTGGISVGEE243 pKa = 4.32GPLGPDD249 pKa = 3.47TDD251 pKa = 4.17PATPEE256 pKa = 4.6DD257 pKa = 4.88DD258 pKa = 3.84PVEE261 pKa = 4.4PPTPEE266 pKa = 3.83DD267 pKa = 3.32AACIRR272 pKa = 11.84QGKK275 pKa = 8.89CPGVVNGQAVCMPCTSQPGGGSSTTTSGTTTNPDD309 pKa = 2.92GTTSTTEE316 pKa = 3.46RR317 pKa = 11.84RR318 pKa = 11.84TTTTCDD324 pKa = 2.84GGQCTTTTTTTTTTRR339 pKa = 11.84DD340 pKa = 3.42AQGNPTGTTTSTEE353 pKa = 4.03SRR355 pKa = 11.84TGPGTGPGSGGNGDD369 pKa = 3.37GDD371 pKa = 3.67GDD373 pKa = 3.82EE374 pKa = 5.0RR375 pKa = 11.84GSSFGGACAAGFACEE390 pKa = 4.86GDD392 pKa = 4.35AIQCAIARR400 pKa = 11.84EE401 pKa = 3.98QHH403 pKa = 5.93IKK405 pKa = 10.05NCRR408 pKa = 11.84FWEE411 pKa = 4.48SKK413 pKa = 10.84GGLSEE418 pKa = 4.32ADD420 pKa = 3.06AVKK423 pKa = 10.82AFDD426 pKa = 4.41DD427 pKa = 5.26ARR429 pKa = 11.84GTDD432 pKa = 3.41AKK434 pKa = 10.55KK435 pKa = 10.97LNAEE439 pKa = 3.85PVAFQNLEE447 pKa = 3.75RR448 pKa = 11.84TAFLGAGTLSDD459 pKa = 3.84VSFTVQGQTLSIPFSEE475 pKa = 4.88LVPFLQAMGLAFMAVCGVIAIGIIRR500 pKa = 11.84TGVAA504 pKa = 3.16
Molecular weight: 51.98 kDa
Isoelectric point according different methods:
Protein with the highest isoelectric point:
>tr|A0A5Q2W8R7|A0A5Q2W8R7_9VIRU Capsid protein G8P OS=Inoviridae sp. ctBZ32 OX=2656729 PE=3 SV=1
MM1 pKa = 7.59PVGLPHH7 pKa = 7.53DD8 pKa = 4.21GRR10 pKa = 11.84RR11 pKa = 11.84GRR13 pKa = 11.84AGLSRR18 pKa = 11.84ARR20 pKa = 11.84SARR23 pKa = 11.84AVTVNRR29 pKa = 11.84GNQAGGTRR37 pKa = 11.84RR38 pKa = 11.84TSGLRR43 pKa = 3.26
MM1 pKa = 7.59PVGLPHH7 pKa = 7.53DD8 pKa = 4.21GRR10 pKa = 11.84RR11 pKa = 11.84GRR13 pKa = 11.84AGLSRR18 pKa = 11.84ARR20 pKa = 11.84SARR23 pKa = 11.84AVTVNRR29 pKa = 11.84GNQAGGTRR37 pKa = 11.84RR38 pKa = 11.84TSGLRR43 pKa = 3.26
Molecular weight: 4.53 kDa
Isoelectric point according different methods:
Peptides (in silico digests for buttom-up proteomics)
Below you can find in silico digests of the whole proteome with Trypsin, Chymotrypsin, Trypsin+LysC, LysN, ArgC proteases suitable for different mass spec machines.| Try ESI |
 |
|---|
| ChTry ESI |
 |
|---|
| ArgC ESI |
 |
|---|
| LysN ESI |
 |
|---|
| TryLysC ESI |
 |
|---|
| Try MALDI |
 |
|---|
| ChTry MALDI |
 |
|---|
| ArgC MALDI |
 |
|---|
| LysN MALDI |
 |
|---|
| TryLysC MALDI |
 |
|---|
| Try LTQ |
 |
|---|
| ChTry LTQ |
 |
|---|
| ArgC LTQ |
 |
|---|
| LysN LTQ |
 |
|---|
| TryLysC LTQ |
 |
|---|
| Try MSlow |
 |
|---|
| ChTry MSlow |
 |
|---|
| ArgC MSlow |
 |
|---|
| LysN MSlow |
 |
|---|
| TryLysC MSlow |
 |
|---|
| Try MShigh |
 |
|---|
| ChTry MShigh |
 |
|---|
| ArgC MShigh |
 |
|---|
| LysN MShigh |
 |
|---|
| TryLysC MShigh |
 |
|---|
General Statistics
Number of major isoforms |
Number of additional isoforms |
Number of all proteins |
Number of amino acids |
Min. Seq. Length |
Max. Seq. Length |
Avg. Seq. Length |
Avg. Mol. Weight |
|---|---|---|---|---|---|---|---|
0 |
1469 |
43 |
504 |
183.6 |
19.53 |
Amino acid frequency
Ala |
Cys |
Asp |
Glu |
Phe |
Gly |
His |
Ile |
Lys |
Leu |
|---|---|---|---|---|---|---|---|---|---|
11.164 ± 0.987 | 2.451 ± 1.047 |
4.084 ± 0.617 | 3.812 ± 0.659 |
3.268 ± 0.2 | 10.211 ± 1.269 |
1.77 ± 0.747 | 3.676 ± 0.629 |
2.655 ± 0.588 | 7.624 ± 1.854 |
Met |
Asn |
Gln |
Pro |
Arg |
Ser |
Thr |
Val |
Trp |
Tyr |
|---|---|---|---|---|---|---|---|---|---|
1.974 ± 0.428 | 1.974 ± 0.728 |
7.624 ± 0.983 | 4.152 ± 0.422 |
7.148 ± 1.251 | 5.718 ± 0.461 |
8.169 ± 2.121 | 9.258 ± 1.187 |
1.838 ± 0.569 | 1.43 ± 0.318 |
Most of the basic statistics you can see at this page can be downloaded from this CSV file
Proteome-pI is available under Creative Commons Attribution-NoDerivs license, for more details see here
| Reference: Kozlowski LP. Proteome-pI 2.0: Proteome Isoelectric Point Database Update. Nucleic Acids Res. 2021, doi: 10.1093/nar/gkab944 | Contact: Lukasz P. Kozlowski |
