Dothistroma septosporum (strain NZE10 / CBS 128990) (Red band needle blight fungus) (Mycosphaerella pini)
Taxonomy: cellular organisms; Eukaryota; Opisthokonta; Fungi; Dikarya; Ascomycota; saccharomyceta; Pezizomycotina; leotiomyceta; dothideomyceta; Dothideomycetes; Dothideomycetidae; Mycosphaerellales; Mycosphaerellaceae; Dothistroma; Dothistroma septosporum
Average proteome isoelectric point is 6.65
Get precalculated fractions of proteins

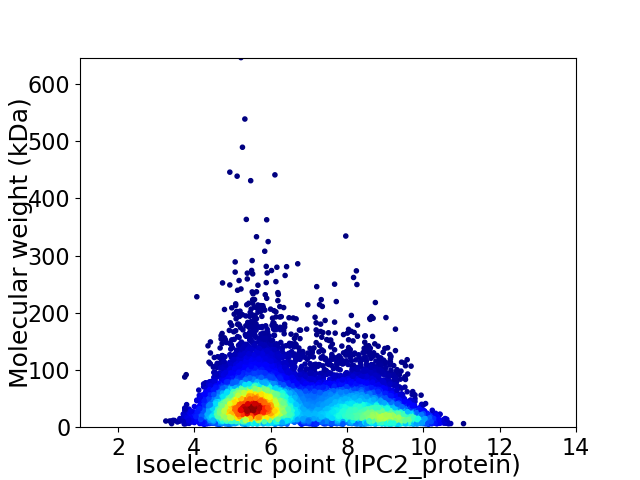
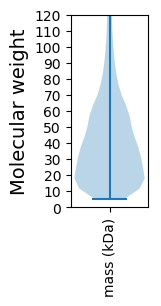
Virtual 2D-PAGE plot for 12414 proteins (isoelectric point calculated using IPC2_protein)
Get csv file with sequences according to given criteria:
* You can choose from 21 different methods for calculating isoelectric point
Summary statistics related to proteome-wise predictions


Protein with the lowest isoelectric point:
>tr|M2YKY2|M2YKY2_DOTSN Uncharacterized protein OS=Dothistroma septosporum (strain NZE10 / CBS 128990) OX=675120 GN=DOTSEDRAFT_48006 PE=4 SV=1
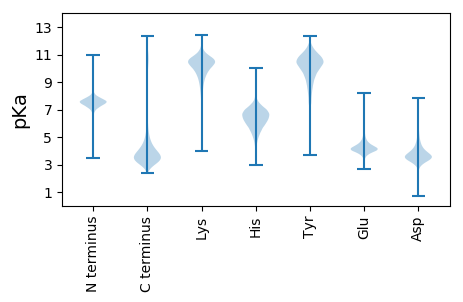
MM1 pKa = 7.38LTTLALALLATSTTASPTKK20 pKa = 10.11RR21 pKa = 11.84QTQVRR26 pKa = 11.84TKK28 pKa = 9.69NYY30 pKa = 10.37SGAKK34 pKa = 9.57LLSSPDD40 pKa = 3.36GTIFTYY46 pKa = 9.12ATTIINVPDD55 pKa = 3.76TQFVSAEE62 pKa = 4.02GSPGQLQASAAWVGYY77 pKa = 10.76GGMEE81 pKa = 4.78DD82 pKa = 3.87NGIAQTGCVFDD93 pKa = 5.85NDD95 pKa = 4.41GQDD98 pKa = 4.1DD99 pKa = 4.42RR100 pKa = 11.84YY101 pKa = 10.55ARR103 pKa = 11.84CWTEE107 pKa = 4.66FYY109 pKa = 10.07PDD111 pKa = 3.9PPVFYY116 pKa = 10.33DD117 pKa = 4.87DD118 pKa = 5.68LPSPDD123 pKa = 3.34IGDD126 pKa = 4.47WIQLEE131 pKa = 4.79LYY133 pKa = 8.06LTSPTTATSIVTNTNTGDD151 pKa = 3.24QASRR155 pKa = 11.84DD156 pKa = 3.65FTAPDD161 pKa = 3.26GHH163 pKa = 6.28SVSGNNAEE171 pKa = 4.47WIVEE175 pKa = 4.15NPGARR180 pKa = 11.84NNLVNFQKK188 pKa = 10.79EE189 pKa = 4.21FFEE192 pKa = 4.93GCQAVTQAGNSYY204 pKa = 10.98GPGDD208 pKa = 3.71GNVEE212 pKa = 3.93VFYY215 pKa = 10.28EE216 pKa = 4.41AKK218 pKa = 10.61DD219 pKa = 3.62LGDD222 pKa = 4.25GNGATQWTNSFLPSDD237 pKa = 4.24SEE239 pKa = 5.3VEE241 pKa = 4.2VDD243 pKa = 3.12WTGPTT248 pKa = 3.35
MM1 pKa = 7.38LTTLALALLATSTTASPTKK20 pKa = 10.11RR21 pKa = 11.84QTQVRR26 pKa = 11.84TKK28 pKa = 9.69NYY30 pKa = 10.37SGAKK34 pKa = 9.57LLSSPDD40 pKa = 3.36GTIFTYY46 pKa = 9.12ATTIINVPDD55 pKa = 3.76TQFVSAEE62 pKa = 4.02GSPGQLQASAAWVGYY77 pKa = 10.76GGMEE81 pKa = 4.78DD82 pKa = 3.87NGIAQTGCVFDD93 pKa = 5.85NDD95 pKa = 4.41GQDD98 pKa = 4.1DD99 pKa = 4.42RR100 pKa = 11.84YY101 pKa = 10.55ARR103 pKa = 11.84CWTEE107 pKa = 4.66FYY109 pKa = 10.07PDD111 pKa = 3.9PPVFYY116 pKa = 10.33DD117 pKa = 4.87DD118 pKa = 5.68LPSPDD123 pKa = 3.34IGDD126 pKa = 4.47WIQLEE131 pKa = 4.79LYY133 pKa = 8.06LTSPTTATSIVTNTNTGDD151 pKa = 3.24QASRR155 pKa = 11.84DD156 pKa = 3.65FTAPDD161 pKa = 3.26GHH163 pKa = 6.28SVSGNNAEE171 pKa = 4.47WIVEE175 pKa = 4.15NPGARR180 pKa = 11.84NNLVNFQKK188 pKa = 10.79EE189 pKa = 4.21FFEE192 pKa = 4.93GCQAVTQAGNSYY204 pKa = 10.98GPGDD208 pKa = 3.71GNVEE212 pKa = 3.93VFYY215 pKa = 10.28EE216 pKa = 4.41AKK218 pKa = 10.61DD219 pKa = 3.62LGDD222 pKa = 4.25GNGATQWTNSFLPSDD237 pKa = 4.24SEE239 pKa = 5.3VEE241 pKa = 4.2VDD243 pKa = 3.12WTGPTT248 pKa = 3.35
Molecular weight: 26.66 kDa
Isoelectric point according different methods:
Protein with the highest isoelectric point:
>tr|M2YMF6|M2YMF6_DOTSN 5-aminolevulinate synthase OS=Dothistroma septosporum (strain NZE10 / CBS 128990) OX=675120 GN=DOTSEDRAFT_72469 PE=3 SV=1
MM1 pKa = 7.87PSHH4 pKa = 5.83KK5 pKa = 9.44TFRR8 pKa = 11.84TKK10 pKa = 10.67VKK12 pKa = 9.81LAKK15 pKa = 9.79AQKK18 pKa = 8.73QNRR21 pKa = 11.84PIPQWIRR28 pKa = 11.84LRR30 pKa = 11.84TGNTIRR36 pKa = 11.84YY37 pKa = 5.79NAKK40 pKa = 8.89RR41 pKa = 11.84RR42 pKa = 11.84HH43 pKa = 4.15WRR45 pKa = 11.84KK46 pKa = 7.38TRR48 pKa = 11.84IGII51 pKa = 4.0
MM1 pKa = 7.87PSHH4 pKa = 5.83KK5 pKa = 9.44TFRR8 pKa = 11.84TKK10 pKa = 10.67VKK12 pKa = 9.81LAKK15 pKa = 9.79AQKK18 pKa = 8.73QNRR21 pKa = 11.84PIPQWIRR28 pKa = 11.84LRR30 pKa = 11.84TGNTIRR36 pKa = 11.84YY37 pKa = 5.79NAKK40 pKa = 8.89RR41 pKa = 11.84RR42 pKa = 11.84HH43 pKa = 4.15WRR45 pKa = 11.84KK46 pKa = 7.38TRR48 pKa = 11.84IGII51 pKa = 4.0
Molecular weight: 6.24 kDa
Isoelectric point according different methods:
Peptides (in silico digests for buttom-up proteomics)
Below you can find in silico digests of the whole proteome with Trypsin, Chymotrypsin, Trypsin+LysC, LysN, ArgC proteases suitable for different mass spec machines.| Try ESI |
 |
|---|
| ChTry ESI |
 |
|---|
| ArgC ESI |
 |
|---|
| LysN ESI |
 |
|---|
| TryLysC ESI |
 |
|---|
| Try MALDI |
 |
|---|
| ChTry MALDI |
 |
|---|
| ArgC MALDI |
 |
|---|
| LysN MALDI |
 |
|---|
| TryLysC MALDI |
 |
|---|
| Try LTQ |
 |
|---|
| ChTry LTQ |
 |
|---|
| ArgC LTQ |
 |
|---|
| LysN LTQ |
 |
|---|
| TryLysC LTQ |
 |
|---|
| Try MSlow |
 |
|---|
| ChTry MSlow |
 |
|---|
| ArgC MSlow |
 |
|---|
| LysN MSlow |
 |
|---|
| TryLysC MSlow |
 |
|---|
| Try MShigh |
 |
|---|
| ChTry MShigh |
 |
|---|
| ArgC MShigh |
 |
|---|
| LysN MShigh |
 |
|---|
| TryLysC MShigh |
 |
|---|
General Statistics
Number of major isoforms |
Number of additional isoforms |
Number of all proteins |
Number of amino acids |
Min. Seq. Length |
Max. Seq. Length |
Avg. Seq. Length |
Avg. Mol. Weight |
|---|---|---|---|---|---|---|---|
5094136 |
49 |
5888 |
410.4 |
45.39 |
Amino acid frequency
Ala |
Cys |
Asp |
Glu |
Phe |
Gly |
His |
Ile |
Lys |
Leu |
|---|---|---|---|---|---|---|---|---|---|
9.079 ± 0.019 | 1.297 ± 0.009 |
5.844 ± 0.017 | 6.093 ± 0.023 |
3.492 ± 0.013 | 6.953 ± 0.023 |
2.549 ± 0.011 | 4.654 ± 0.014 |
4.901 ± 0.021 | 8.561 ± 0.024 |
Met |
Asn |
Gln |
Pro |
Arg |
Ser |
Thr |
Val |
Trp |
Tyr |
|---|---|---|---|---|---|---|---|---|---|
2.264 ± 0.009 | 3.61 ± 0.012 |
5.801 ± 0.02 | 4.294 ± 0.017 |
6.295 ± 0.021 | 7.982 ± 0.027 |
6.046 ± 0.017 | 6.075 ± 0.016 |
1.456 ± 0.009 | 2.755 ± 0.012 |
Most of the basic statistics you can see at this page can be downloaded from this CSV file
Proteome-pI is available under Creative Commons Attribution-NoDerivs license, for more details see here
| Reference: Kozlowski LP. Proteome-pI 2.0: Proteome Isoelectric Point Database Update. Nucleic Acids Res. 2021, doi: 10.1093/nar/gkab944 | Contact: Lukasz P. Kozlowski |
