Rhizobium etli (strain CFN 42 / ATCC 51251)
Taxonomy: cellular organisms; Bacteria; Proteobacteria; Alphaproteobacteria; Hyphomicrobiales; Rhizobiaceae; Rhizobium/Agrobacterium group; Rhizobium; Rhizobium etli
Average proteome isoelectric point is 6.54
Get precalculated fractions of proteins

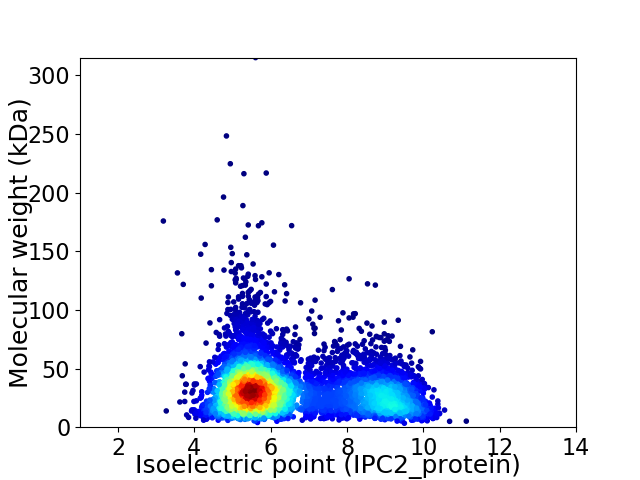
Virtual 2D-PAGE plot for 5921 proteins (isoelectric point calculated using IPC2_protein)
Get csv file with sequences according to given criteria:
* You can choose from 21 different methods for calculating isoelectric point
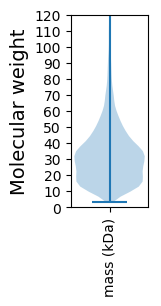
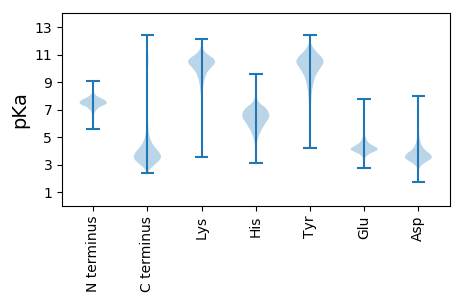
Summary statistics related to proteome-wise predictions


Protein with the lowest isoelectric point:
>tr|Q2K4Q3|Q2K4Q3_RHIEC Hypothetical conserved protein OS=Rhizobium etli (strain CFN 42 / ATCC 51251) OX=347834 GN=RHE_CH03426 PE=3 SV=1
MM1 pKa = 7.67ANHH4 pKa = 6.68KK5 pKa = 9.75PVAADD10 pKa = 3.67VYY12 pKa = 11.13QPIFDD17 pKa = 3.54IDD19 pKa = 3.77KK20 pKa = 10.39PVDD23 pKa = 3.55GNILDD28 pKa = 4.37GSTDD32 pKa = 3.44ADD34 pKa = 3.62GDD36 pKa = 4.08LVRR39 pKa = 11.84LNFVNGQRR47 pKa = 11.84IPQPANPDD55 pKa = 3.27GPATTTTIEE64 pKa = 4.22GKK66 pKa = 10.54YY67 pKa = 9.18GTLTVYY73 pKa = 11.16SNGYY77 pKa = 6.85YY78 pKa = 9.97TYY80 pKa = 10.68EE81 pKa = 4.52LDD83 pKa = 3.24HH84 pKa = 6.82SNPVVSALGPGDD96 pKa = 3.64QLLDD100 pKa = 3.27QFNFKK105 pKa = 10.45ISDD108 pKa = 3.65GKK110 pKa = 10.95GATDD114 pKa = 4.75FGLLNIAVDD123 pKa = 4.0LPEE126 pKa = 6.29RR127 pKa = 11.84GDD129 pKa = 3.2IFVNFEE135 pKa = 4.25DD136 pKa = 3.29VGKK139 pKa = 10.75YY140 pKa = 9.88DD141 pKa = 4.19FPTGYY146 pKa = 10.64KK147 pKa = 10.54GFDD150 pKa = 2.61WGAWHH155 pKa = 7.52DD156 pKa = 4.11GDD158 pKa = 5.13DD159 pKa = 4.37AAIQKK164 pKa = 9.68EE165 pKa = 3.94ADD167 pKa = 3.51GNHH170 pKa = 5.84YY171 pKa = 10.76LSGGVFWTPIQAADD185 pKa = 3.31GGTFQIEE192 pKa = 4.34QFSVANGTSDD202 pKa = 3.6YY203 pKa = 11.55DD204 pKa = 3.55NVLTIEE210 pKa = 4.24GRR212 pKa = 11.84LNGDD216 pKa = 3.39TVFLVTVNVTADD228 pKa = 3.94SIHH231 pKa = 7.19DD232 pKa = 3.78PQAIDD237 pKa = 3.74LSAYY241 pKa = 9.45GQIDD245 pKa = 4.39YY246 pKa = 10.93LVLDD250 pKa = 4.21TEE252 pKa = 4.46PVITEE257 pKa = 3.99TSGPDD262 pKa = 3.43YY263 pKa = 11.38YY264 pKa = 11.19GAQYY268 pKa = 11.44DD269 pKa = 3.41NFYY272 pKa = 11.06FVVV275 pKa = 3.42
MM1 pKa = 7.67ANHH4 pKa = 6.68KK5 pKa = 9.75PVAADD10 pKa = 3.67VYY12 pKa = 11.13QPIFDD17 pKa = 3.54IDD19 pKa = 3.77KK20 pKa = 10.39PVDD23 pKa = 3.55GNILDD28 pKa = 4.37GSTDD32 pKa = 3.44ADD34 pKa = 3.62GDD36 pKa = 4.08LVRR39 pKa = 11.84LNFVNGQRR47 pKa = 11.84IPQPANPDD55 pKa = 3.27GPATTTTIEE64 pKa = 4.22GKK66 pKa = 10.54YY67 pKa = 9.18GTLTVYY73 pKa = 11.16SNGYY77 pKa = 6.85YY78 pKa = 9.97TYY80 pKa = 10.68EE81 pKa = 4.52LDD83 pKa = 3.24HH84 pKa = 6.82SNPVVSALGPGDD96 pKa = 3.64QLLDD100 pKa = 3.27QFNFKK105 pKa = 10.45ISDD108 pKa = 3.65GKK110 pKa = 10.95GATDD114 pKa = 4.75FGLLNIAVDD123 pKa = 4.0LPEE126 pKa = 6.29RR127 pKa = 11.84GDD129 pKa = 3.2IFVNFEE135 pKa = 4.25DD136 pKa = 3.29VGKK139 pKa = 10.75YY140 pKa = 9.88DD141 pKa = 4.19FPTGYY146 pKa = 10.64KK147 pKa = 10.54GFDD150 pKa = 2.61WGAWHH155 pKa = 7.52DD156 pKa = 4.11GDD158 pKa = 5.13DD159 pKa = 4.37AAIQKK164 pKa = 9.68EE165 pKa = 3.94ADD167 pKa = 3.51GNHH170 pKa = 5.84YY171 pKa = 10.76LSGGVFWTPIQAADD185 pKa = 3.31GGTFQIEE192 pKa = 4.34QFSVANGTSDD202 pKa = 3.6YY203 pKa = 11.55DD204 pKa = 3.55NVLTIEE210 pKa = 4.24GRR212 pKa = 11.84LNGDD216 pKa = 3.39TVFLVTVNVTADD228 pKa = 3.94SIHH231 pKa = 7.19DD232 pKa = 3.78PQAIDD237 pKa = 3.74LSAYY241 pKa = 9.45GQIDD245 pKa = 4.39YY246 pKa = 10.93LVLDD250 pKa = 4.21TEE252 pKa = 4.46PVITEE257 pKa = 3.99TSGPDD262 pKa = 3.43YY263 pKa = 11.38YY264 pKa = 11.19GAQYY268 pKa = 11.44DD269 pKa = 3.41NFYY272 pKa = 11.06FVVV275 pKa = 3.42
Molecular weight: 29.9 kDa
Isoelectric point according different methods:
Protein with the highest isoelectric point:
>tr|Q2KDF8|Q2KDF8_RHIEC Endolytic peptidoglycan transglycosylase RlpA OS=Rhizobium etli (strain CFN 42 / ATCC 51251) OX=347834 GN=rlpA PE=3 SV=1
MM1 pKa = 7.35KK2 pKa = 9.43RR3 pKa = 11.84TYY5 pKa = 10.27QPSKK9 pKa = 9.73LVRR12 pKa = 11.84KK13 pKa = 9.15RR14 pKa = 11.84RR15 pKa = 11.84HH16 pKa = 4.46GFRR19 pKa = 11.84ARR21 pKa = 11.84MSTKK25 pKa = 10.17GGRR28 pKa = 11.84KK29 pKa = 9.04VIAARR34 pKa = 11.84RR35 pKa = 11.84AQGRR39 pKa = 11.84KK40 pKa = 9.21RR41 pKa = 11.84LSAA44 pKa = 3.93
MM1 pKa = 7.35KK2 pKa = 9.43RR3 pKa = 11.84TYY5 pKa = 10.27QPSKK9 pKa = 9.73LVRR12 pKa = 11.84KK13 pKa = 9.15RR14 pKa = 11.84RR15 pKa = 11.84HH16 pKa = 4.46GFRR19 pKa = 11.84ARR21 pKa = 11.84MSTKK25 pKa = 10.17GGRR28 pKa = 11.84KK29 pKa = 9.04VIAARR34 pKa = 11.84RR35 pKa = 11.84AQGRR39 pKa = 11.84KK40 pKa = 9.21RR41 pKa = 11.84LSAA44 pKa = 3.93
Molecular weight: 5.15 kDa
Isoelectric point according different methods:
Peptides (in silico digests for buttom-up proteomics)
Below you can find in silico digests of the whole proteome with Trypsin, Chymotrypsin, Trypsin+LysC, LysN, ArgC proteases suitable for different mass spec machines.| Try ESI |
 |
|---|
| ChTry ESI |
 |
|---|
| ArgC ESI |
 |
|---|
| LysN ESI |
 |
|---|
| TryLysC ESI |
 |
|---|
| Try MALDI |
 |
|---|
| ChTry MALDI |
 |
|---|
| ArgC MALDI |
 |
|---|
| LysN MALDI |
 |
|---|
| TryLysC MALDI |
 |
|---|
| Try LTQ |
 |
|---|
| ChTry LTQ |
 |
|---|
| ArgC LTQ |
 |
|---|
| LysN LTQ |
 |
|---|
| TryLysC LTQ |
 |
|---|
| Try MSlow |
 |
|---|
| ChTry MSlow |
 |
|---|
| ArgC MSlow |
 |
|---|
| LysN MSlow |
 |
|---|
| TryLysC MSlow |
 |
|---|
| Try MShigh |
 |
|---|
| ChTry MShigh |
 |
|---|
| ArgC MShigh |
 |
|---|
| LysN MShigh |
 |
|---|
| TryLysC MShigh |
 |
|---|
General Statistics
Number of major isoforms |
Number of additional isoforms |
Number of all proteins |
Number of amino acids |
Min. Seq. Length |
Max. Seq. Length |
Avg. Seq. Length |
Avg. Mol. Weight |
|---|---|---|---|---|---|---|---|
1851644 |
32 |
2825 |
312.7 |
34.09 |
Amino acid frequency
Ala |
Cys |
Asp |
Glu |
Phe |
Gly |
His |
Ile |
Lys |
Leu |
|---|---|---|---|---|---|---|---|---|---|
11.897 ± 0.038 | 0.848 ± 0.01 |
5.646 ± 0.026 | 5.804 ± 0.029 |
3.931 ± 0.02 | 8.244 ± 0.025 |
2.066 ± 0.016 | 5.73 ± 0.025 |
3.682 ± 0.024 | 9.936 ± 0.035 |
Met |
Asn |
Gln |
Pro |
Arg |
Ser |
Thr |
Val |
Trp |
Tyr |
|---|---|---|---|---|---|---|---|---|---|
2.526 ± 0.013 | 2.865 ± 0.02 |
4.892 ± 0.021 | 3.101 ± 0.019 |
6.901 ± 0.032 | 5.887 ± 0.026 |
5.226 ± 0.022 | 7.183 ± 0.024 |
1.296 ± 0.014 | 2.337 ± 0.016 |
Most of the basic statistics you can see at this page can be downloaded from this CSV file
Proteome-pI is available under Creative Commons Attribution-NoDerivs license, for more details see here
| Reference: Kozlowski LP. Proteome-pI 2.0: Proteome Isoelectric Point Database Update. Nucleic Acids Res. 2021, doi: 10.1093/nar/gkab944 | Contact: Lukasz P. Kozlowski |
