Switchgrass mosaic-associated virus 1
Taxonomy: Viruses; Monodnaviria; Shotokuvirae; Cressdnaviricota; Repensiviricetes; Geplafuvirales; Geminiviridae; Mastrevirus; Switchgrass mosaic-associated virus
Average proteome isoelectric point is 7.52
Get precalculated fractions of proteins

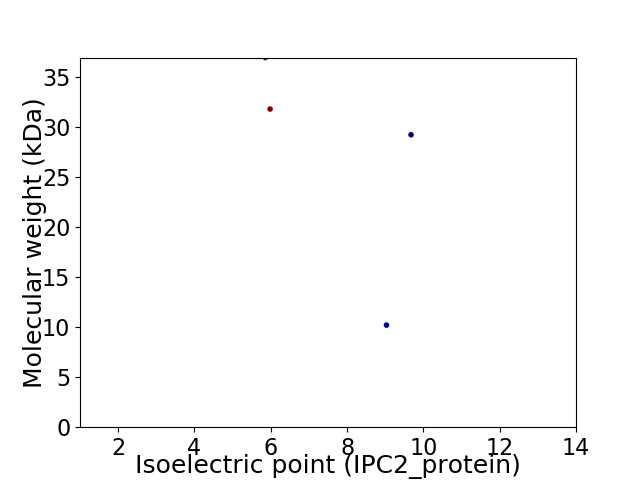
Virtual 2D-PAGE plot for 4 proteins (isoelectric point calculated using IPC2_protein)
Get csv file with sequences according to given criteria:
* You can choose from 21 different methods for calculating isoelectric point
Summary statistics related to proteome-wise predictions


Protein with the lowest isoelectric point:
>tr|A0A0A0QTH0|A0A0A0QTH0_9GEMI Movement protein OS=Switchgrass mosaic-associated virus 1 OX=1571533 PE=3 SV=1
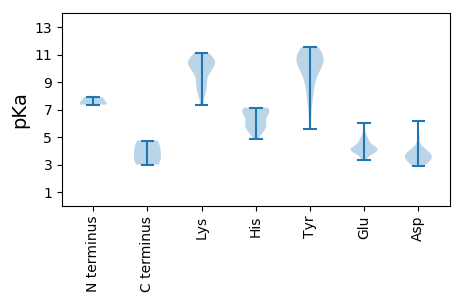
MM1 pKa = 7.36SFSSDD6 pKa = 3.48SADD9 pKa = 2.86GGIPNEE15 pKa = 4.0RR16 pKa = 11.84RR17 pKa = 11.84IHH19 pKa = 6.05PGSNFKK25 pKa = 10.53FDD27 pKa = 3.97SNEE30 pKa = 3.36IFLTYY35 pKa = 9.2PRR37 pKa = 11.84CSAEE41 pKa = 3.98PMDD44 pKa = 3.81VGNYY48 pKa = 8.66LWTLLLTLSPKK59 pKa = 10.34YY60 pKa = 10.16VLCTRR65 pKa = 11.84EE66 pKa = 3.53RR67 pKa = 11.84HH68 pKa = 6.01ADD70 pKa = 3.5GTFHH74 pKa = 7.1LHH76 pKa = 7.08AFVQLGYY83 pKa = 11.21NLVTANPHH91 pKa = 5.63HH92 pKa = 7.14LDD94 pKa = 3.17YY95 pKa = 10.84RR96 pKa = 11.84QYY98 pKa = 10.6HH99 pKa = 6.73PNVQPVRR106 pKa = 11.84SSRR109 pKa = 11.84SVRR112 pKa = 11.84DD113 pKa = 3.4YY114 pKa = 11.22CLKK117 pKa = 10.96NPIDD121 pKa = 3.4QYY123 pKa = 10.6TRR125 pKa = 11.84GRR127 pKa = 11.84YY128 pKa = 7.41SARR131 pKa = 11.84TGVRR135 pKa = 11.84NGSTSRR141 pKa = 11.84MGEE144 pKa = 4.0SAADD148 pKa = 3.51WEE150 pKa = 4.89SKK152 pKa = 7.32NQKK155 pKa = 8.57MATIFATATSRR166 pKa = 11.84DD167 pKa = 3.75EE168 pKa = 4.01YY169 pKa = 11.34LSLVKK174 pKa = 8.64TTFPFDD180 pKa = 3.11WATKK184 pKa = 9.22LQAFEE189 pKa = 4.31YY190 pKa = 9.83SASKK194 pKa = 10.44LFPEE198 pKa = 4.59VEE200 pKa = 4.32PEE202 pKa = 4.03YY203 pKa = 9.51EE204 pKa = 4.2TPDD207 pKa = 2.88WATQLRR213 pKa = 11.84CPEE216 pKa = 5.3RR217 pKa = 11.84IADD220 pKa = 3.83WANHH224 pKa = 5.44NVFQTALYY232 pKa = 10.23NIIDD236 pKa = 5.12DD237 pKa = 4.0IPFKK241 pKa = 10.77FCHH244 pKa = 5.82CWKK247 pKa = 10.61SLVGSQKK254 pKa = 11.11DD255 pKa = 3.66YY256 pKa = 11.23IVNPKK261 pKa = 9.59YY262 pKa = 10.75GKK264 pKa = 9.55KK265 pKa = 10.04KK266 pKa = 10.16KK267 pKa = 9.65IAGGIPSIIIVNEE280 pKa = 4.11DD281 pKa = 3.63EE282 pKa = 4.69DD283 pKa = 4.34WLPKK287 pKa = 8.07MTAAQRR293 pKa = 11.84SYY295 pKa = 11.4FEE297 pKa = 4.87ANCEE301 pKa = 3.67VHH303 pKa = 6.36YY304 pKa = 10.4LYY306 pKa = 11.05EE307 pKa = 4.96GDD309 pKa = 4.24SFFAVPEE316 pKa = 3.99QASPDD321 pKa = 3.59LL322 pKa = 4.18
MM1 pKa = 7.36SFSSDD6 pKa = 3.48SADD9 pKa = 2.86GGIPNEE15 pKa = 4.0RR16 pKa = 11.84RR17 pKa = 11.84IHH19 pKa = 6.05PGSNFKK25 pKa = 10.53FDD27 pKa = 3.97SNEE30 pKa = 3.36IFLTYY35 pKa = 9.2PRR37 pKa = 11.84CSAEE41 pKa = 3.98PMDD44 pKa = 3.81VGNYY48 pKa = 8.66LWTLLLTLSPKK59 pKa = 10.34YY60 pKa = 10.16VLCTRR65 pKa = 11.84EE66 pKa = 3.53RR67 pKa = 11.84HH68 pKa = 6.01ADD70 pKa = 3.5GTFHH74 pKa = 7.1LHH76 pKa = 7.08AFVQLGYY83 pKa = 11.21NLVTANPHH91 pKa = 5.63HH92 pKa = 7.14LDD94 pKa = 3.17YY95 pKa = 10.84RR96 pKa = 11.84QYY98 pKa = 10.6HH99 pKa = 6.73PNVQPVRR106 pKa = 11.84SSRR109 pKa = 11.84SVRR112 pKa = 11.84DD113 pKa = 3.4YY114 pKa = 11.22CLKK117 pKa = 10.96NPIDD121 pKa = 3.4QYY123 pKa = 10.6TRR125 pKa = 11.84GRR127 pKa = 11.84YY128 pKa = 7.41SARR131 pKa = 11.84TGVRR135 pKa = 11.84NGSTSRR141 pKa = 11.84MGEE144 pKa = 4.0SAADD148 pKa = 3.51WEE150 pKa = 4.89SKK152 pKa = 7.32NQKK155 pKa = 8.57MATIFATATSRR166 pKa = 11.84DD167 pKa = 3.75EE168 pKa = 4.01YY169 pKa = 11.34LSLVKK174 pKa = 8.64TTFPFDD180 pKa = 3.11WATKK184 pKa = 9.22LQAFEE189 pKa = 4.31YY190 pKa = 9.83SASKK194 pKa = 10.44LFPEE198 pKa = 4.59VEE200 pKa = 4.32PEE202 pKa = 4.03YY203 pKa = 9.51EE204 pKa = 4.2TPDD207 pKa = 2.88WATQLRR213 pKa = 11.84CPEE216 pKa = 5.3RR217 pKa = 11.84IADD220 pKa = 3.83WANHH224 pKa = 5.44NVFQTALYY232 pKa = 10.23NIIDD236 pKa = 5.12DD237 pKa = 4.0IPFKK241 pKa = 10.77FCHH244 pKa = 5.82CWKK247 pKa = 10.61SLVGSQKK254 pKa = 11.11DD255 pKa = 3.66YY256 pKa = 11.23IVNPKK261 pKa = 9.59YY262 pKa = 10.75GKK264 pKa = 9.55KK265 pKa = 10.04KK266 pKa = 10.16KK267 pKa = 9.65IAGGIPSIIIVNEE280 pKa = 4.11DD281 pKa = 3.63EE282 pKa = 4.69DD283 pKa = 4.34WLPKK287 pKa = 8.07MTAAQRR293 pKa = 11.84SYY295 pKa = 11.4FEE297 pKa = 4.87ANCEE301 pKa = 3.67VHH303 pKa = 6.36YY304 pKa = 10.4LYY306 pKa = 11.05EE307 pKa = 4.96GDD309 pKa = 4.24SFFAVPEE316 pKa = 3.99QASPDD321 pKa = 3.59LL322 pKa = 4.18
Molecular weight: 36.95 kDa
Isoelectric point according different methods:
Protein with the highest isoelectric point:
>tr|A0A0A0QVW5|A0A0A0QVW5_9GEMI Capsid protein OS=Switchgrass mosaic-associated virus 1 OX=1571533 PE=3 SV=1
MM1 pKa = 7.91PSRR4 pKa = 11.84SRR6 pKa = 11.84YY7 pKa = 6.05TYY9 pKa = 9.99KK10 pKa = 10.48RR11 pKa = 11.84KK12 pKa = 10.07RR13 pKa = 11.84PAKK16 pKa = 9.08RR17 pKa = 11.84ARR19 pKa = 11.84VEE21 pKa = 3.69PWPPEE26 pKa = 3.98LTRR29 pKa = 11.84LGYY32 pKa = 8.39TPRR35 pKa = 11.84DD36 pKa = 3.18TVLRR40 pKa = 11.84GTRR43 pKa = 11.84RR44 pKa = 11.84RR45 pKa = 11.84DD46 pKa = 3.32GRR48 pKa = 11.84PSLQVINYY56 pKa = 5.56TWKK59 pKa = 9.93NDD61 pKa = 3.0GSAVTIGNGGGVYY74 pKa = 10.79LLTEE78 pKa = 4.87FPRR81 pKa = 11.84GDD83 pKa = 4.24AEE85 pKa = 4.32DD86 pKa = 3.6QRR88 pKa = 11.84HH89 pKa = 4.86TGEE92 pKa = 3.91TLTYY96 pKa = 9.87KK97 pKa = 10.65VSLNLQFAVQEE108 pKa = 4.51DD109 pKa = 3.81YY110 pKa = 11.24RR111 pKa = 11.84KK112 pKa = 10.09YY113 pKa = 10.83CNRR116 pKa = 11.84AQNMVFLVYY125 pKa = 10.29DD126 pKa = 4.17AQPTGTNPKK135 pKa = 8.42ITDD138 pKa = 3.35IFHH141 pKa = 6.72IAASQFFPIPATWMVSRR158 pKa = 11.84EE159 pKa = 3.73NSHH162 pKa = 6.52RR163 pKa = 11.84FVIKK167 pKa = 10.14RR168 pKa = 11.84KK169 pKa = 8.39WMFITEE175 pKa = 4.31VNGSGTAKK183 pKa = 10.55DD184 pKa = 3.89YY185 pKa = 11.55TNAPCYY191 pKa = 8.33PAHH194 pKa = 6.89FSLIFKK200 pKa = 10.46RR201 pKa = 11.84FVQRR205 pKa = 11.84LGVRR209 pKa = 11.84TEE211 pKa = 4.02WKK213 pKa = 10.08NSTEE217 pKa = 4.02GGIGAISKK225 pKa = 10.27GAMYY229 pKa = 10.15LIIAPGNGMPLEE241 pKa = 4.12ARR243 pKa = 11.84GNIRR247 pKa = 11.84LYY249 pKa = 10.5FKK251 pKa = 11.01SIGNQQ256 pKa = 3.0
MM1 pKa = 7.91PSRR4 pKa = 11.84SRR6 pKa = 11.84YY7 pKa = 6.05TYY9 pKa = 9.99KK10 pKa = 10.48RR11 pKa = 11.84KK12 pKa = 10.07RR13 pKa = 11.84PAKK16 pKa = 9.08RR17 pKa = 11.84ARR19 pKa = 11.84VEE21 pKa = 3.69PWPPEE26 pKa = 3.98LTRR29 pKa = 11.84LGYY32 pKa = 8.39TPRR35 pKa = 11.84DD36 pKa = 3.18TVLRR40 pKa = 11.84GTRR43 pKa = 11.84RR44 pKa = 11.84RR45 pKa = 11.84DD46 pKa = 3.32GRR48 pKa = 11.84PSLQVINYY56 pKa = 5.56TWKK59 pKa = 9.93NDD61 pKa = 3.0GSAVTIGNGGGVYY74 pKa = 10.79LLTEE78 pKa = 4.87FPRR81 pKa = 11.84GDD83 pKa = 4.24AEE85 pKa = 4.32DD86 pKa = 3.6QRR88 pKa = 11.84HH89 pKa = 4.86TGEE92 pKa = 3.91TLTYY96 pKa = 9.87KK97 pKa = 10.65VSLNLQFAVQEE108 pKa = 4.51DD109 pKa = 3.81YY110 pKa = 11.24RR111 pKa = 11.84KK112 pKa = 10.09YY113 pKa = 10.83CNRR116 pKa = 11.84AQNMVFLVYY125 pKa = 10.29DD126 pKa = 4.17AQPTGTNPKK135 pKa = 8.42ITDD138 pKa = 3.35IFHH141 pKa = 6.72IAASQFFPIPATWMVSRR158 pKa = 11.84EE159 pKa = 3.73NSHH162 pKa = 6.52RR163 pKa = 11.84FVIKK167 pKa = 10.14RR168 pKa = 11.84KK169 pKa = 8.39WMFITEE175 pKa = 4.31VNGSGTAKK183 pKa = 10.55DD184 pKa = 3.89YY185 pKa = 11.55TNAPCYY191 pKa = 8.33PAHH194 pKa = 6.89FSLIFKK200 pKa = 10.46RR201 pKa = 11.84FVQRR205 pKa = 11.84LGVRR209 pKa = 11.84TEE211 pKa = 4.02WKK213 pKa = 10.08NSTEE217 pKa = 4.02GGIGAISKK225 pKa = 10.27GAMYY229 pKa = 10.15LIIAPGNGMPLEE241 pKa = 4.12ARR243 pKa = 11.84GNIRR247 pKa = 11.84LYY249 pKa = 10.5FKK251 pKa = 11.01SIGNQQ256 pKa = 3.0
Molecular weight: 29.24 kDa
Isoelectric point according different methods:
Peptides (in silico digests for buttom-up proteomics)
Below you can find in silico digests of the whole proteome with Trypsin, Chymotrypsin, Trypsin+LysC, LysN, ArgC proteases suitable for different mass spec machines.| Try ESI |
 |
|---|
| ChTry ESI |
 |
|---|
| ArgC ESI |
 |
|---|
| LysN ESI |
 |
|---|
| TryLysC ESI |
 |
|---|
| Try MALDI |
 |
|---|
| ChTry MALDI |
 |
|---|
| ArgC MALDI |
 |
|---|
| LysN MALDI |
 |
|---|
| TryLysC MALDI |
 |
|---|
| Try LTQ |
 |
|---|
| ChTry LTQ |
 |
|---|
| ArgC LTQ |
 |
|---|
| LysN LTQ |
 |
|---|
| TryLysC LTQ |
 |
|---|
| Try MSlow |
 |
|---|
| ChTry MSlow |
 |
|---|
| ArgC MSlow |
 |
|---|
| LysN MSlow |
 |
|---|
| TryLysC MSlow |
 |
|---|
| Try MShigh |
 |
|---|
| ChTry MShigh |
 |
|---|
| ArgC MShigh |
 |
|---|
| LysN MShigh |
 |
|---|
| TryLysC MShigh |
 |
|---|
General Statistics
Number of major isoforms |
Number of additional isoforms |
Number of all proteins |
Number of amino acids |
Min. Seq. Length |
Max. Seq. Length |
Avg. Seq. Length |
Avg. Mol. Weight |
|---|---|---|---|---|---|---|---|
0 |
957 |
99 |
322 |
239.3 |
27.05 |
Amino acid frequency
Ala |
Cys |
Asp |
Glu |
Phe |
Gly |
His |
Ile |
Lys |
Leu |
|---|---|---|---|---|---|---|---|---|---|
8.15 ± 0.745 | 1.567 ± 0.3 |
4.702 ± 0.657 | 5.225 ± 0.617 |
4.598 ± 0.31 | 6.688 ± 1.235 |
2.508 ± 0.529 | 4.493 ± 0.682 |
4.284 ± 0.665 | 7.001 ± 0.413 |
Met |
Asn |
Gln |
Pro |
Arg |
Ser |
Thr |
Val |
Trp |
Tyr |
|---|---|---|---|---|---|---|---|---|---|
1.881 ± 0.224 | 4.807 ± 0.254 |
6.479 ± 0.39 | 3.553 ± 0.3 |
7.315 ± 0.886 | 7.732 ± 0.871 |
7.001 ± 0.482 | 5.016 ± 0.155 |
2.09 ± 0.047 | 4.911 ± 0.339 |
Most of the basic statistics you can see at this page can be downloaded from this CSV file
Proteome-pI is available under Creative Commons Attribution-NoDerivs license, for more details see here
| Reference: Kozlowski LP. Proteome-pI 2.0: Proteome Isoelectric Point Database Update. Nucleic Acids Res. 2021, doi: 10.1093/nar/gkab944 | Contact: Lukasz P. Kozlowski |
