Rhodococcus aetherivorans
Taxonomy: cellular organisms; Bacteria; Terrabacteria group; Actinobacteria; Actinomycetia; Corynebacteriales; Nocardiaceae; Rhodococcus
Average proteome isoelectric point is 6.08
Get precalculated fractions of proteins
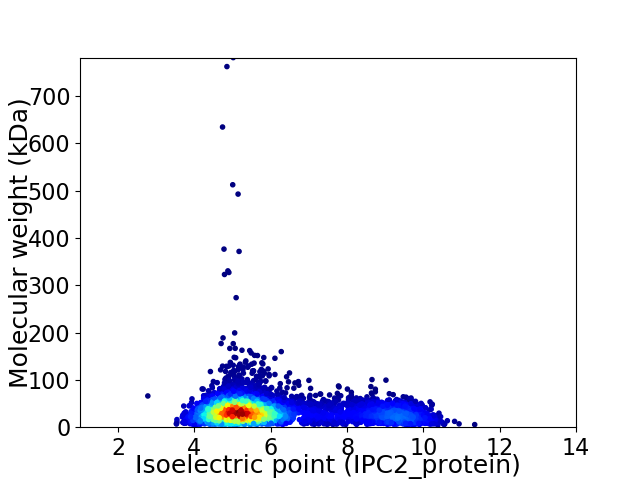
Virtual 2D-PAGE plot for 5509 proteins (isoelectric point calculated using IPC2_protein)
Get csv file with sequences according to given criteria:
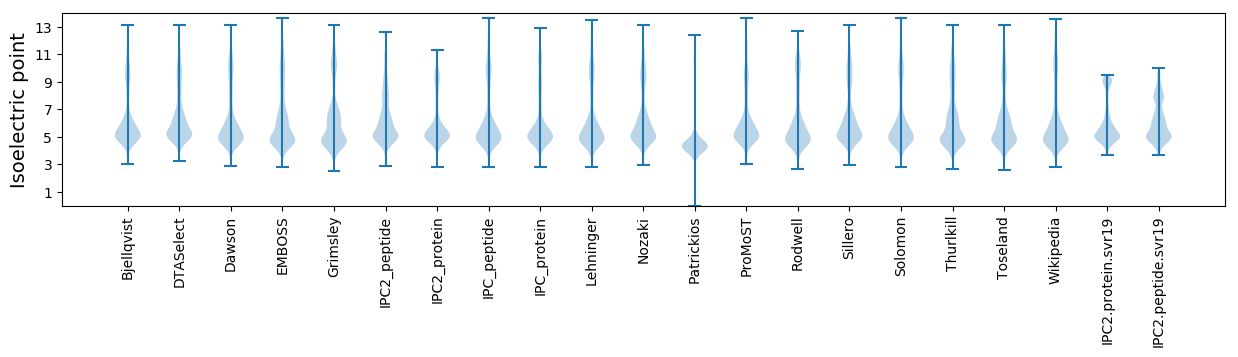
* You can choose from 21 different methods for calculating isoelectric point
Summary statistics related to proteome-wise predictions
Protein with the lowest isoelectric point:
>tr|A0A059MHW6|A0A059MHW6_9NOCA Peptidase M13 OS=Rhodococcus aetherivorans OX=191292 GN=N505_0120845 PE=4 SV=1
MM1 pKa = 7.17NFIRR5 pKa = 11.84RR6 pKa = 11.84VSGTAVALAAAALVLGACGSDD27 pKa = 3.24VEE29 pKa = 4.47PRR31 pKa = 11.84AVPEE35 pKa = 4.46SGSEE39 pKa = 4.1TTSASASDD47 pKa = 3.27TRR49 pKa = 11.84TTTGRR54 pKa = 11.84PTTTTAPTSPGSSGLDD70 pKa = 2.76IDD72 pKa = 5.41VEE74 pKa = 4.2IGDD77 pKa = 4.46CVRR80 pKa = 11.84LGGTVDD86 pKa = 4.2DD87 pKa = 4.42ATIEE91 pKa = 4.09NATCGSMDD99 pKa = 3.67SNYY102 pKa = 10.56KK103 pKa = 10.63VIDD106 pKa = 3.54IVDD109 pKa = 3.64SSEE112 pKa = 4.1QCVSDD117 pKa = 4.42ADD119 pKa = 3.5QTYY122 pKa = 8.17YY123 pKa = 10.79EE124 pKa = 4.38SSAGVEE130 pKa = 4.2VGALCLDD137 pKa = 3.79VDD139 pKa = 4.21WVVDD143 pKa = 3.59SCMDD147 pKa = 3.4ISGEE151 pKa = 3.89DD152 pKa = 3.83PQRR155 pKa = 11.84VDD157 pKa = 3.64CAAPGPEE164 pKa = 4.17TEE166 pKa = 4.92KK167 pKa = 10.15VTEE170 pKa = 3.94ILQNTDD176 pKa = 2.8NVNDD180 pKa = 3.92CSVSEE185 pKa = 4.12GGFVYY190 pKa = 9.84SEE192 pKa = 3.9RR193 pKa = 11.84RR194 pKa = 11.84FVVCTDD200 pKa = 3.38TLL202 pKa = 3.7
MM1 pKa = 7.17NFIRR5 pKa = 11.84RR6 pKa = 11.84VSGTAVALAAAALVLGACGSDD27 pKa = 3.24VEE29 pKa = 4.47PRR31 pKa = 11.84AVPEE35 pKa = 4.46SGSEE39 pKa = 4.1TTSASASDD47 pKa = 3.27TRR49 pKa = 11.84TTTGRR54 pKa = 11.84PTTTTAPTSPGSSGLDD70 pKa = 2.76IDD72 pKa = 5.41VEE74 pKa = 4.2IGDD77 pKa = 4.46CVRR80 pKa = 11.84LGGTVDD86 pKa = 4.2DD87 pKa = 4.42ATIEE91 pKa = 4.09NATCGSMDD99 pKa = 3.67SNYY102 pKa = 10.56KK103 pKa = 10.63VIDD106 pKa = 3.54IVDD109 pKa = 3.64SSEE112 pKa = 4.1QCVSDD117 pKa = 4.42ADD119 pKa = 3.5QTYY122 pKa = 8.17YY123 pKa = 10.79EE124 pKa = 4.38SSAGVEE130 pKa = 4.2VGALCLDD137 pKa = 3.79VDD139 pKa = 4.21WVVDD143 pKa = 3.59SCMDD147 pKa = 3.4ISGEE151 pKa = 3.89DD152 pKa = 3.83PQRR155 pKa = 11.84VDD157 pKa = 3.64CAAPGPEE164 pKa = 4.17TEE166 pKa = 4.92KK167 pKa = 10.15VTEE170 pKa = 3.94ILQNTDD176 pKa = 2.8NVNDD180 pKa = 3.92CSVSEE185 pKa = 4.12GGFVYY190 pKa = 9.84SEE192 pKa = 3.9RR193 pKa = 11.84RR194 pKa = 11.84FVVCTDD200 pKa = 3.38TLL202 pKa = 3.7
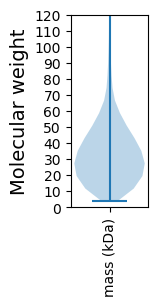
Molecular weight: 20.97 kDa
Isoelectric point according different methods:
Protein with the highest isoelectric point:
>tr|A0A059MKB0|A0A059MKB0_9NOCA GABA permease OS=Rhodococcus aetherivorans OX=191292 GN=N505_0124105 PE=4 SV=1
MM1 pKa = 7.69AKK3 pKa = 10.06GKK5 pKa = 8.69RR6 pKa = 11.84TFQPNNRR13 pKa = 11.84RR14 pKa = 11.84RR15 pKa = 11.84ARR17 pKa = 11.84VHH19 pKa = 5.99GFRR22 pKa = 11.84LRR24 pKa = 11.84MRR26 pKa = 11.84TRR28 pKa = 11.84AGRR31 pKa = 11.84AIVSARR37 pKa = 11.84RR38 pKa = 11.84RR39 pKa = 11.84KK40 pKa = 10.08GRR42 pKa = 11.84TSLTAA47 pKa = 3.9
MM1 pKa = 7.69AKK3 pKa = 10.06GKK5 pKa = 8.69RR6 pKa = 11.84TFQPNNRR13 pKa = 11.84RR14 pKa = 11.84RR15 pKa = 11.84ARR17 pKa = 11.84VHH19 pKa = 5.99GFRR22 pKa = 11.84LRR24 pKa = 11.84MRR26 pKa = 11.84TRR28 pKa = 11.84AGRR31 pKa = 11.84AIVSARR37 pKa = 11.84RR38 pKa = 11.84RR39 pKa = 11.84KK40 pKa = 10.08GRR42 pKa = 11.84TSLTAA47 pKa = 3.9
Molecular weight: 5.51 kDa
Isoelectric point according different methods:
Peptides (in silico digests for buttom-up proteomics)
Below you can find in silico digests of the whole proteome with Trypsin, Chymotrypsin, Trypsin+LysC, LysN, ArgC proteases suitable for different mass spec machines.| Try ESI |
 |
|---|
| ChTry ESI |
|
|---|
| ArgC ESI |
|
|---|
| LysN ESI |
|
|---|
| TryLysC ESI |
|
|---|
| Try MALDI |
|
|---|
| ChTry MALDI |
|
|---|
| ArgC MALDI |
|
|---|
| LysN MALDI |
|
|---|
| TryLysC MALDI |
|
|---|
| Try LTQ |
|
|---|
| ChTry LTQ |
|
|---|
| ArgC LTQ |
|
|---|
| LysN LTQ |
|
|---|
| TryLysC LTQ |
|
|---|
| Try MSlow |
|
|---|
| ChTry MSlow |
|
|---|
| ArgC MSlow |
|
|---|
| LysN MSlow |
|
|---|
| TryLysC MSlow |
|
|---|
| Try MShigh |
|
|---|
| ChTry MShigh |
|
|---|
| ArgC MShigh |
|
|---|
| LysN MShigh |
|
|---|
| TryLysC MShigh |
|
|---|
General Statistics
Number of major isoforms |
Number of additional isoforms |
Number of all proteins |
Number of amino acids |
Min. Seq. Length |
Max. Seq. Length |
Avg. Seq. Length |
Avg. Mol. Weight |
|---|---|---|---|---|---|---|---|
0 |
1815698 |
32 |
7327 |
329.6 |
35.31 |
Amino acid frequency
Ala |
Cys |
Asp |
Glu |
Phe |
Gly |
His |
Ile |
Lys |
Leu |
|---|---|---|---|---|---|---|---|---|---|
13.479 ± 0.054 | 0.758 ± 0.01 |
6.287 ± 0.026 | 5.652 ± 0.028 |
2.948 ± 0.019 | 9.126 ± 0.028 |
2.264 ± 0.015 | 3.724 ± 0.021 |
1.774 ± 0.021 | 10.19 ± 0.037 |
Met |
Asn |
Gln |
Pro |
Arg |
Ser |
Thr |
Val |
Trp |
Tyr |
|---|---|---|---|---|---|---|---|---|---|
1.831 ± 0.014 | 1.797 ± 0.015 |
5.859 ± 0.03 | 2.579 ± 0.018 |
7.948 ± 0.035 | 4.914 ± 0.023 |
6.192 ± 0.021 | 9.212 ± 0.035 |
1.449 ± 0.015 | 2.017 ± 0.016 |
Most of the basic statistics you can see at this page can be downloaded from this CSV file
See this proteome in:

Proteome-pI is available under Creative Commons Attribution-NoDerivs license, for more details see here
| Reference: Kozlowski LP. Proteome-pI 2.0: Proteome Isoelectric Point Database Update. Nucleic Acids Res. 2021, doi: 10.1093/nar/gkab944 | Contact: Lukasz P. Kozlowski |