Psychromonas sp. PRT-SC03
Taxonomy: cellular organisms; Bacteria; Proteobacteria; Gammaproteobacteria; Alteromonadales; Psychromonadaceae; Psychromonas; unclassified Psychromonas
Average proteome isoelectric point is 6.87
Get precalculated fractions of proteins

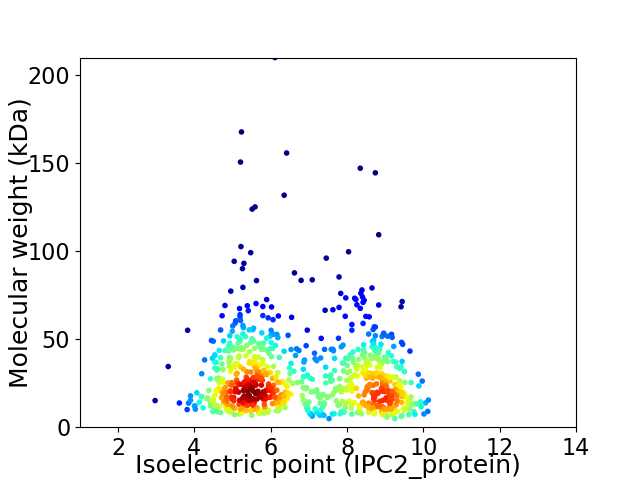
Virtual 2D-PAGE plot for 787 proteins (isoelectric point calculated using IPC2_protein)
Get csv file with sequences according to given criteria:
* You can choose from 21 different methods for calculating isoelectric point
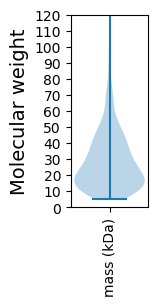
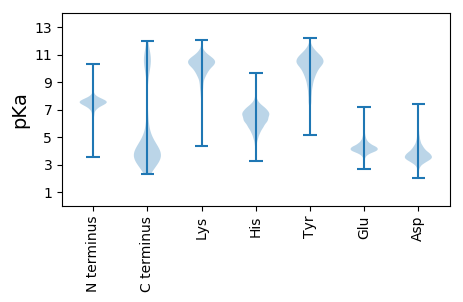
Summary statistics related to proteome-wise predictions


Protein with the lowest isoelectric point:
>tr|A0A0P8Y8T9|A0A0P8Y8T9_9GAMM Uncharacterized protein OS=Psychromonas sp. PRT-SC03 OX=1527299 GN=JI57_00610 PE=4 SV=1
MM1 pKa = 7.45PARR4 pKa = 11.84RR5 pKa = 11.84LLLLGIGNILYY16 pKa = 9.96GDD18 pKa = 3.83EE19 pKa = 4.82GIGVHH24 pKa = 6.77FINYY28 pKa = 9.56ISDD31 pKa = 3.39KK32 pKa = 11.16YY33 pKa = 10.83KK34 pKa = 10.42IEE36 pKa = 4.15NPAYY40 pKa = 9.99EE41 pKa = 4.23FDD43 pKa = 3.79IVDD46 pKa = 4.38GGTLAHH52 pKa = 6.75GLIPLLATYY61 pKa = 10.7DD62 pKa = 3.68DD63 pKa = 5.52LIIVDD68 pKa = 5.19TINSADD74 pKa = 3.68GEE76 pKa = 4.34FGDD79 pKa = 5.29VYY81 pKa = 11.04FFDD84 pKa = 5.42FDD86 pKa = 3.89ATPADD91 pKa = 3.56
MM1 pKa = 7.45PARR4 pKa = 11.84RR5 pKa = 11.84LLLLGIGNILYY16 pKa = 9.96GDD18 pKa = 3.83EE19 pKa = 4.82GIGVHH24 pKa = 6.77FINYY28 pKa = 9.56ISDD31 pKa = 3.39KK32 pKa = 11.16YY33 pKa = 10.83KK34 pKa = 10.42IEE36 pKa = 4.15NPAYY40 pKa = 9.99EE41 pKa = 4.23FDD43 pKa = 3.79IVDD46 pKa = 4.38GGTLAHH52 pKa = 6.75GLIPLLATYY61 pKa = 10.7DD62 pKa = 3.68DD63 pKa = 5.52LIIVDD68 pKa = 5.19TINSADD74 pKa = 3.68GEE76 pKa = 4.34FGDD79 pKa = 5.29VYY81 pKa = 11.04FFDD84 pKa = 5.42FDD86 pKa = 3.89ATPADD91 pKa = 3.56
Molecular weight: 10.02 kDa
Isoelectric point according different methods:
Protein with the highest isoelectric point:
>tr|A0A0P8YU10|A0A0P8YU10_9GAMM HTH cro/C1-type domain-containing protein OS=Psychromonas sp. PRT-SC03 OX=1527299 GN=JI57_04605 PE=4 SV=1
RR1 pKa = 7.11HH2 pKa = 6.07RR3 pKa = 11.84HH4 pKa = 5.73SGRR7 pKa = 11.84QLNRR11 pKa = 11.84NSSHH15 pKa = 5.69RR16 pKa = 11.84QAMFRR21 pKa = 11.84NMASSIVEE29 pKa = 3.93HH30 pKa = 6.14EE31 pKa = 4.62VIKK34 pKa = 8.71TTLPKK39 pKa = 10.57AKK41 pKa = 9.36EE42 pKa = 3.81LRR44 pKa = 11.84RR45 pKa = 11.84GVEE48 pKa = 3.86PLITLAKK55 pKa = 8.41TDD57 pKa = 3.43SVANRR62 pKa = 11.84RR63 pKa = 11.84LAFARR68 pKa = 11.84TRR70 pKa = 11.84DD71 pKa = 3.59NAVVAKK77 pKa = 9.87LFNEE81 pKa = 4.47LGPRR85 pKa = 11.84YY86 pKa = 9.78ANRR89 pKa = 11.84PGGYY93 pKa = 7.82TRR95 pKa = 11.84IITCGFSNGDD105 pKa = 4.05KK106 pKa = 11.2APMAYY111 pKa = 9.05IEE113 pKa = 4.24FVDD116 pKa = 3.84RR117 pKa = 11.84AVVADD122 pKa = 4.34EE123 pKa = 4.13EE124 pKa = 4.46AA125 pKa = 3.99
RR1 pKa = 7.11HH2 pKa = 6.07RR3 pKa = 11.84HH4 pKa = 5.73SGRR7 pKa = 11.84QLNRR11 pKa = 11.84NSSHH15 pKa = 5.69RR16 pKa = 11.84QAMFRR21 pKa = 11.84NMASSIVEE29 pKa = 3.93HH30 pKa = 6.14EE31 pKa = 4.62VIKK34 pKa = 8.71TTLPKK39 pKa = 10.57AKK41 pKa = 9.36EE42 pKa = 3.81LRR44 pKa = 11.84RR45 pKa = 11.84GVEE48 pKa = 3.86PLITLAKK55 pKa = 8.41TDD57 pKa = 3.43SVANRR62 pKa = 11.84RR63 pKa = 11.84LAFARR68 pKa = 11.84TRR70 pKa = 11.84DD71 pKa = 3.59NAVVAKK77 pKa = 9.87LFNEE81 pKa = 4.47LGPRR85 pKa = 11.84YY86 pKa = 9.78ANRR89 pKa = 11.84PGGYY93 pKa = 7.82TRR95 pKa = 11.84IITCGFSNGDD105 pKa = 4.05KK106 pKa = 11.2APMAYY111 pKa = 9.05IEE113 pKa = 4.24FVDD116 pKa = 3.84RR117 pKa = 11.84AVVADD122 pKa = 4.34EE123 pKa = 4.13EE124 pKa = 4.46AA125 pKa = 3.99
Molecular weight: 14.08 kDa
Isoelectric point according different methods:
Peptides (in silico digests for buttom-up proteomics)
Below you can find in silico digests of the whole proteome with Trypsin, Chymotrypsin, Trypsin+LysC, LysN, ArgC proteases suitable for different mass spec machines.| Try ESI |
 |
|---|
| ChTry ESI |
 |
|---|
| ArgC ESI |
 |
|---|
| LysN ESI |
 |
|---|
| TryLysC ESI |
 |
|---|
| Try MALDI |
 |
|---|
| ChTry MALDI |
 |
|---|
| ArgC MALDI |
 |
|---|
| LysN MALDI |
 |
|---|
| TryLysC MALDI |
 |
|---|
| Try LTQ |
 |
|---|
| ChTry LTQ |
 |
|---|
| ArgC LTQ |
 |
|---|
| LysN LTQ |
 |
|---|
| TryLysC LTQ |
 |
|---|
| Try MSlow |
 |
|---|
| ChTry MSlow |
 |
|---|
| ArgC MSlow |
 |
|---|
| LysN MSlow |
 |
|---|
| TryLysC MSlow |
 |
|---|
| Try MShigh |
 |
|---|
| ChTry MShigh |
 |
|---|
| ArgC MShigh |
 |
|---|
| LysN MShigh |
 |
|---|
| TryLysC MShigh |
 |
|---|
General Statistics
Number of major isoforms |
Number of additional isoforms |
Number of all proteins |
Number of amino acids |
Min. Seq. Length |
Max. Seq. Length |
Avg. Seq. Length |
Avg. Mol. Weight |
|---|---|---|---|---|---|---|---|
0 |
213425 |
43 |
1903 |
271.2 |
30.28 |
Amino acid frequency
Ala |
Cys |
Asp |
Glu |
Phe |
Gly |
His |
Ile |
Lys |
Leu |
|---|---|---|---|---|---|---|---|---|---|
7.946 ± 0.086 | 1.244 ± 0.037 |
5.304 ± 0.068 | 5.597 ± 0.103 |
4.231 ± 0.072 | 6.224 ± 0.095 |
2.236 ± 0.044 | 7.718 ± 0.078 |
6.8 ± 0.084 | 11.004 ± 0.111 |
Met |
Asn |
Gln |
Pro |
Arg |
Ser |
Thr |
Val |
Trp |
Tyr |
|---|---|---|---|---|---|---|---|---|---|
2.555 ± 0.044 | 4.781 ± 0.061 |
3.371 ± 0.052 | 4.626 ± 0.078 |
4.112 ± 0.082 | 6.767 ± 0.076 |
5.164 ± 0.059 | 6.277 ± 0.072 |
0.983 ± 0.029 | 3.06 ± 0.052 |
Most of the basic statistics you can see at this page can be downloaded from this CSV file
Proteome-pI is available under Creative Commons Attribution-NoDerivs license, for more details see here
| Reference: Kozlowski LP. Proteome-pI 2.0: Proteome Isoelectric Point Database Update. Nucleic Acids Res. 2021, doi: 10.1093/nar/gkab944 | Contact: Lukasz P. Kozlowski |
