Infectious bronchitis virus
Taxonomy: Viruses; Riboviria; Orthornavirae; Pisuviricota; Pisoniviricetes; Nidovirales; Cornidovirineae; Coronaviridae; Orthocoronavirinae; Gammacoronavirus; Igacovirus; Avian coronavirus
Average proteome isoelectric point is 7.19
Get precalculated fractions of proteins
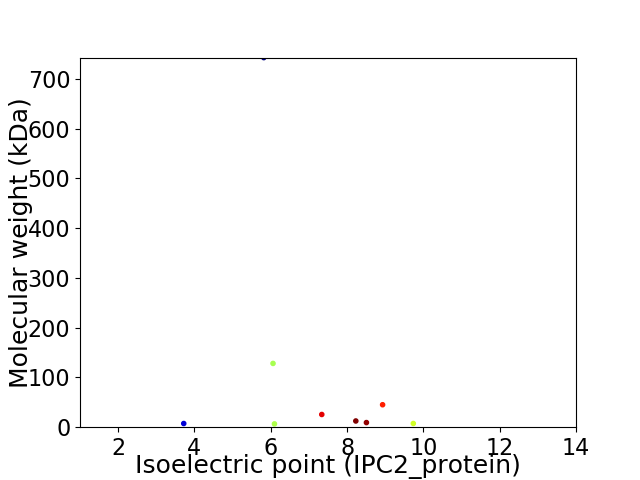
Virtual 2D-PAGE plot for 9 proteins (isoelectric point calculated using IPC2_protein)
Get csv file with sequences according to given criteria:
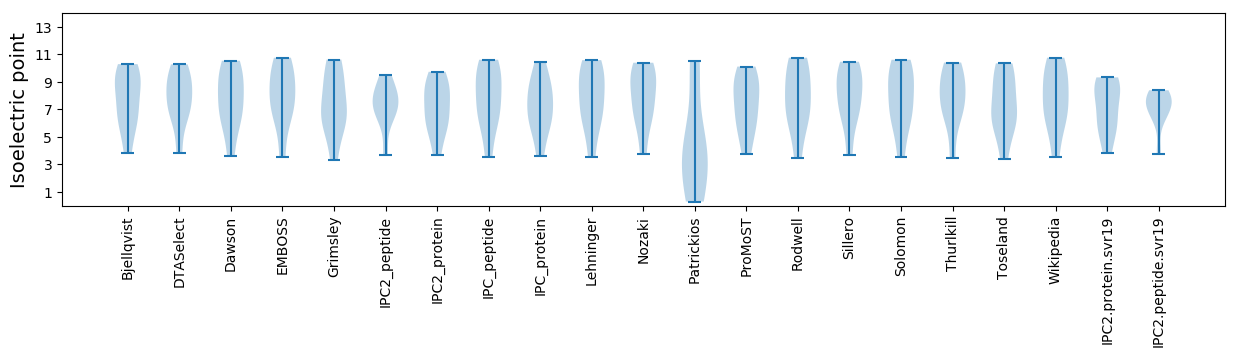
* You can choose from 21 different methods for calculating isoelectric point
Summary statistics related to proteome-wise predictions
Protein with the lowest isoelectric point:
>tr|Q9J4A9|Q9J4A9_9GAMC Accessory protein 3a OS=Infectious bronchitis virus OX=11120 GN=3a PE=4 SV=1
MM1 pKa = 7.6LNLEE5 pKa = 4.9AIIEE9 pKa = 4.32TGDD12 pKa = 3.44QVIQKK17 pKa = 10.01ISFNLQHH24 pKa = 6.73ISSVLNTEE32 pKa = 3.84VFDD35 pKa = 4.52PFDD38 pKa = 3.29YY39 pKa = 10.68CYY41 pKa = 11.2YY42 pKa = 10.31RR43 pKa = 11.84GGNFWEE49 pKa = 4.43IEE51 pKa = 4.21SAEE54 pKa = 4.26DD55 pKa = 4.39CSGDD59 pKa = 4.48DD60 pKa = 4.1EE61 pKa = 5.77FIEE64 pKa = 4.42
MM1 pKa = 7.6LNLEE5 pKa = 4.9AIIEE9 pKa = 4.32TGDD12 pKa = 3.44QVIQKK17 pKa = 10.01ISFNLQHH24 pKa = 6.73ISSVLNTEE32 pKa = 3.84VFDD35 pKa = 4.52PFDD38 pKa = 3.29YY39 pKa = 10.68CYY41 pKa = 11.2YY42 pKa = 10.31RR43 pKa = 11.84GGNFWEE49 pKa = 4.43IEE51 pKa = 4.21SAEE54 pKa = 4.26DD55 pKa = 4.39CSGDD59 pKa = 4.48DD60 pKa = 4.1EE61 pKa = 5.77FIEE64 pKa = 4.42
Molecular weight: 7.4 kDa
Isoelectric point according different methods:
Protein with the highest isoelectric point:
>tr|Q9J4A7|Q9J4A7_9GAMC Envelope small membrane protein OS=Infectious bronchitis virus OX=11120 GN=3c PE=3 SV=1
MM1 pKa = 7.47KK2 pKa = 9.77WLTSFGRR9 pKa = 11.84AVISCYY15 pKa = 10.12KK16 pKa = 10.68ALLLTQLRR24 pKa = 11.84VLDD27 pKa = 4.68RR28 pKa = 11.84LILDD32 pKa = 4.38HH33 pKa = 6.65GPKK36 pKa = 9.86RR37 pKa = 11.84VLTCGRR43 pKa = 11.84RR44 pKa = 11.84VLLSQLDD51 pKa = 3.76LVYY54 pKa = 10.83RR55 pKa = 11.84LAYY58 pKa = 9.49TPTQSLVV65 pKa = 3.06
MM1 pKa = 7.47KK2 pKa = 9.77WLTSFGRR9 pKa = 11.84AVISCYY15 pKa = 10.12KK16 pKa = 10.68ALLLTQLRR24 pKa = 11.84VLDD27 pKa = 4.68RR28 pKa = 11.84LILDD32 pKa = 4.38HH33 pKa = 6.65GPKK36 pKa = 9.86RR37 pKa = 11.84VLTCGRR43 pKa = 11.84RR44 pKa = 11.84VLLSQLDD51 pKa = 3.76LVYY54 pKa = 10.83RR55 pKa = 11.84LAYY58 pKa = 9.49TPTQSLVV65 pKa = 3.06
Molecular weight: 7.47 kDa
Isoelectric point according different methods:
Peptides (in silico digests for buttom-up proteomics)
Below you can find in silico digests of the whole proteome with Trypsin, Chymotrypsin, Trypsin+LysC, LysN, ArgC proteases suitable for different mass spec machines.| Try ESI |
 |
|---|
| ChTry ESI |
|
|---|
| ArgC ESI |
|
|---|
| LysN ESI |
|
|---|
| TryLysC ESI |
|
|---|
| Try MALDI |
|
|---|
| ChTry MALDI |
|
|---|
| ArgC MALDI |
|
|---|
| LysN MALDI |
|
|---|
| TryLysC MALDI |
|
|---|
| Try LTQ |
|
|---|
| ChTry LTQ |
|
|---|
| ArgC LTQ |
|
|---|
| LysN LTQ |
|
|---|
| TryLysC LTQ |
|
|---|
| Try MSlow |
|
|---|
| ChTry MSlow |
|
|---|
| ArgC MSlow |
|
|---|
| LysN MSlow |
|
|---|
| TryLysC MSlow |
|
|---|
| Try MShigh |
|
|---|
| ChTry MShigh |
|
|---|
| ArgC MShigh |
|
|---|
| LysN MShigh |
|
|---|
| TryLysC MShigh |
|
|---|
General Statistics
Number of major isoforms |
Number of additional isoforms |
Number of all proteins |
Number of amino acids |
Min. Seq. Length |
Max. Seq. Length |
Avg. Seq. Length |
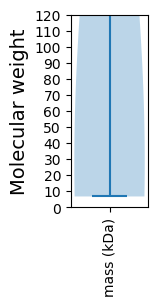
Avg. Mol. Weight |
|---|---|---|---|---|---|---|---|
0 |
8783 |
57 |
6610 |
975.9 |
109.4 |
Amino acid frequency
Ala |
Cys |
Asp |
Glu |
Phe |
Gly |
His |
Ile |
Lys |
Leu |
|---|---|---|---|---|---|---|---|---|---|
6.672 ± 0.281 | 3.222 ± 0.311 |
5.545 ± 0.809 | 4.566 ± 0.54 |
5.579 ± 0.36 | 6.171 ± 0.546 |
1.799 ± 0.394 | 5.317 ± 0.625 |
6.046 ± 0.831 | 8.562 ± 0.775 |
Met |
Asn |
Gln |
Pro |
Arg |
Ser |
Thr |
Val |
Trp |
Tyr |
|---|---|---|---|---|---|---|---|---|---|
1.776 ± 0.162 | 5.636 ± 0.576 |
3.883 ± 0.473 | 3.655 ± 0.75 |
3.643 ± 0.897 | 6.809 ± 0.786 |
5.966 ± 0.506 | 9.074 ± 1.334 |
1.344 ± 0.292 | 4.736 ± 0.445 |
Most of the basic statistics you can see at this page can be downloaded from this CSV file
See this proteome in:

Proteome-pI is available under Creative Commons Attribution-NoDerivs license, for more details see here
| Reference: Kozlowski LP. Proteome-pI 2.0: Proteome Isoelectric Point Database Update. Nucleic Acids Res. 2021, doi: 10.1093/nar/gkab944 | Contact: Lukasz P. Kozlowski |