Lentisphaera araneosa HTCC2155
Taxonomy: cellular organisms; Bacteria; PVC group; Lentisphaerae; Lentisphaeria; Lentisphaerales; Lentisphaeraceae; Lentisphaera; Lentisphaera araneosa
Average proteome isoelectric point is 6.79
Get precalculated fractions of proteins

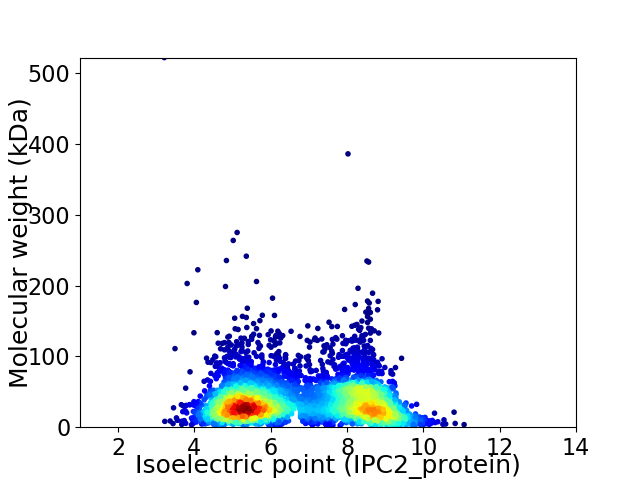
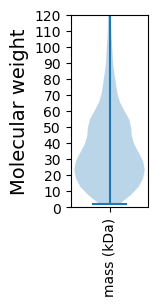
Virtual 2D-PAGE plot for 4982 proteins (isoelectric point calculated using IPC2_protein)
Get csv file with sequences according to given criteria:
* You can choose from 21 different methods for calculating isoelectric point
Summary statistics related to proteome-wise predictions


Protein with the lowest isoelectric point:
>tr|A6DGE7|A6DGE7_9BACT N-acetylgalactosamine 6-sulfatase (GALNS) OS=Lentisphaera araneosa HTCC2155 OX=313628 GN=LNTAR_22779 PE=3 SV=1
MM1 pKa = 7.2YY2 pKa = 9.88GANGKK7 pKa = 9.59DD8 pKa = 3.59DD9 pKa = 3.95SLHH12 pKa = 6.86AGLEE16 pKa = 4.32SPTTYY21 pKa = 10.74GGAGFTNKK29 pKa = 9.81SATWTWVGEE38 pKa = 3.9AAAARR43 pKa = 11.84VTVEE47 pKa = 4.18VPSSGIHH54 pKa = 6.74TIRR57 pKa = 11.84IWQRR61 pKa = 11.84EE62 pKa = 4.16DD63 pKa = 2.76GTRR66 pKa = 11.84LDD68 pKa = 4.9KK69 pKa = 10.98IIVSNISSYY78 pKa = 10.68TPDD81 pKa = 4.49GIGPPEE87 pKa = 4.18SPMNIISTEE96 pKa = 3.88SSVDD100 pKa = 3.36EE101 pKa = 4.02NSIVSNEE108 pKa = 3.84NSSDD112 pKa = 3.62DD113 pKa = 4.45SSSQSYY119 pKa = 10.31GSSSILTGTNSIYY132 pKa = 10.86EE133 pKa = 4.38DD134 pKa = 4.04LNSTLLVLNGSNFILEE150 pKa = 4.15IVTAEE155 pKa = 3.74GSYY158 pKa = 11.07LFGCTYY164 pKa = 11.02GDD166 pKa = 3.68SFEE169 pKa = 4.34STIIDD174 pKa = 4.36DD175 pKa = 3.78FTFDD179 pKa = 4.28IIYY182 pKa = 10.1SDD184 pKa = 3.19SSEE187 pKa = 3.81IEE189 pKa = 4.06EE190 pKa = 5.07FIHH193 pKa = 7.35SLFDD197 pKa = 3.58EE198 pKa = 4.49NEE200 pKa = 4.05IIDD203 pKa = 3.96ILLVEE208 pKa = 4.52
MM1 pKa = 7.2YY2 pKa = 9.88GANGKK7 pKa = 9.59DD8 pKa = 3.59DD9 pKa = 3.95SLHH12 pKa = 6.86AGLEE16 pKa = 4.32SPTTYY21 pKa = 10.74GGAGFTNKK29 pKa = 9.81SATWTWVGEE38 pKa = 3.9AAAARR43 pKa = 11.84VTVEE47 pKa = 4.18VPSSGIHH54 pKa = 6.74TIRR57 pKa = 11.84IWQRR61 pKa = 11.84EE62 pKa = 4.16DD63 pKa = 2.76GTRR66 pKa = 11.84LDD68 pKa = 4.9KK69 pKa = 10.98IIVSNISSYY78 pKa = 10.68TPDD81 pKa = 4.49GIGPPEE87 pKa = 4.18SPMNIISTEE96 pKa = 3.88SSVDD100 pKa = 3.36EE101 pKa = 4.02NSIVSNEE108 pKa = 3.84NSSDD112 pKa = 3.62DD113 pKa = 4.45SSSQSYY119 pKa = 10.31GSSSILTGTNSIYY132 pKa = 10.86EE133 pKa = 4.38DD134 pKa = 4.04LNSTLLVLNGSNFILEE150 pKa = 4.15IVTAEE155 pKa = 3.74GSYY158 pKa = 11.07LFGCTYY164 pKa = 11.02GDD166 pKa = 3.68SFEE169 pKa = 4.34STIIDD174 pKa = 4.36DD175 pKa = 3.78FTFDD179 pKa = 4.28IIYY182 pKa = 10.1SDD184 pKa = 3.19SSEE187 pKa = 3.81IEE189 pKa = 4.06EE190 pKa = 5.07FIHH193 pKa = 7.35SLFDD197 pKa = 3.58EE198 pKa = 4.49NEE200 pKa = 4.05IIDD203 pKa = 3.96ILLVEE208 pKa = 4.52
Molecular weight: 22.49 kDa
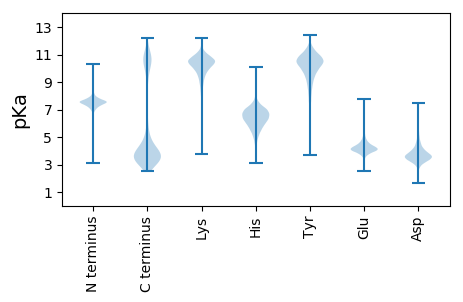
Isoelectric point according different methods:
Protein with the highest isoelectric point:
>tr|A6DU75|A6DU75_9BACT N-acetylgalactosamine 6-sulfate sulfatase (GALNS) OS=Lentisphaera araneosa HTCC2155 OX=313628 GN=LNTAR_09921 PE=4 SV=1
MM1 pKa = 7.6GNLRR5 pKa = 11.84KK6 pKa = 9.66KK7 pKa = 10.29RR8 pKa = 11.84RR9 pKa = 11.84SKK11 pKa = 9.72IAKK14 pKa = 8.79HH15 pKa = 5.52KK16 pKa = 10.17RR17 pKa = 11.84RR18 pKa = 11.84KK19 pKa = 8.31QSRR22 pKa = 11.84KK23 pKa = 8.82NRR25 pKa = 11.84HH26 pKa = 4.05KK27 pKa = 9.8TKK29 pKa = 10.85
MM1 pKa = 7.6GNLRR5 pKa = 11.84KK6 pKa = 9.66KK7 pKa = 10.29RR8 pKa = 11.84RR9 pKa = 11.84SKK11 pKa = 9.72IAKK14 pKa = 8.79HH15 pKa = 5.52KK16 pKa = 10.17RR17 pKa = 11.84RR18 pKa = 11.84KK19 pKa = 8.31QSRR22 pKa = 11.84KK23 pKa = 8.82NRR25 pKa = 11.84HH26 pKa = 4.05KK27 pKa = 9.8TKK29 pKa = 10.85
Molecular weight: 3.66 kDa
Isoelectric point according different methods:
Peptides (in silico digests for buttom-up proteomics)
Below you can find in silico digests of the whole proteome with Trypsin, Chymotrypsin, Trypsin+LysC, LysN, ArgC proteases suitable for different mass spec machines.| Try ESI |
 |
|---|
| ChTry ESI |
 |
|---|
| ArgC ESI |
 |
|---|
| LysN ESI |
 |
|---|
| TryLysC ESI |
 |
|---|
| Try MALDI |
 |
|---|
| ChTry MALDI |
 |
|---|
| ArgC MALDI |
 |
|---|
| LysN MALDI |
 |
|---|
| TryLysC MALDI |
 |
|---|
| Try LTQ |
 |
|---|
| ChTry LTQ |
 |
|---|
| ArgC LTQ |
 |
|---|
| LysN LTQ |
 |
|---|
| TryLysC LTQ |
 |
|---|
| Try MSlow |
 |
|---|
| ChTry MSlow |
 |
|---|
| ArgC MSlow |
 |
|---|
| LysN MSlow |
 |
|---|
| TryLysC MSlow |
 |
|---|
| Try MShigh |
 |
|---|
| ChTry MShigh |
 |
|---|
| ArgC MShigh |
 |
|---|
| LysN MShigh |
 |
|---|
| TryLysC MShigh |
 |
|---|
General Statistics
Number of major isoforms |
Number of additional isoforms |
Number of all proteins |
Number of amino acids |
Min. Seq. Length |
Max. Seq. Length |
Avg. Seq. Length |
Avg. Mol. Weight |
|---|---|---|---|---|---|---|---|
0 |
1741385 |
20 |
4990 |
349.5 |
39.49 |
Amino acid frequency
Ala |
Cys |
Asp |
Glu |
Phe |
Gly |
His |
Ile |
Lys |
Leu |
|---|---|---|---|---|---|---|---|---|---|
6.965 ± 0.029 | 1.178 ± 0.012 |
5.861 ± 0.031 | 6.66 ± 0.032 |
4.597 ± 0.021 | 6.335 ± 0.036 |
2.322 ± 0.017 | 6.646 ± 0.031 |
7.937 ± 0.037 | 9.813 ± 0.036 |
Met |
Asn |
Gln |
Pro |
Arg |
Ser |
Thr |
Val |
Trp |
Tyr |
|---|---|---|---|---|---|---|---|---|---|
2.46 ± 0.017 | 4.943 ± 0.024 |
3.934 ± 0.023 | 3.848 ± 0.02 |
4.252 ± 0.024 | 6.974 ± 0.025 |
4.832 ± 0.029 | 5.493 ± 0.026 |
1.332 ± 0.013 | 3.616 ± 0.021 |
Most of the basic statistics you can see at this page can be downloaded from this CSV file
Proteome-pI is available under Creative Commons Attribution-NoDerivs license, for more details see here
| Reference: Kozlowski LP. Proteome-pI 2.0: Proteome Isoelectric Point Database Update. Nucleic Acids Res. 2021, doi: 10.1093/nar/gkab944 | Contact: Lukasz P. Kozlowski |
