Acetobacter pasteurianus (strain NBRC 3283 / LMG 1513 / CCTM 1153)
Taxonomy: cellular organisms; Bacteria; Proteobacteria; Alphaproteobacteria; Rhodospirillales; Acetobacteraceae; Acetobacter; Acetobacter pasteurianus
Average proteome isoelectric point is 6.77
Get precalculated fractions of proteins

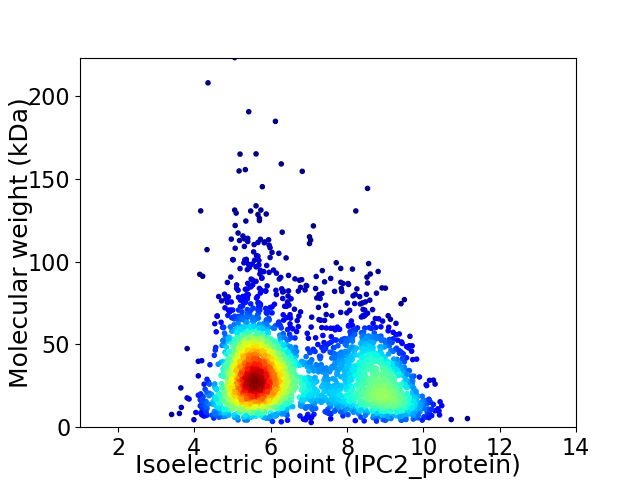
Virtual 2D-PAGE plot for 2906 proteins (isoelectric point calculated using IPC2_protein)
Get csv file with sequences according to given criteria:
* You can choose from 21 different methods for calculating isoelectric point
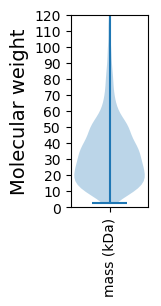
Summary statistics related to proteome-wise predictions


Protein with the lowest isoelectric point:
>tr|C7JH16|C7JH16_ACEP3 Phosphoribosyl-ATP pyrophosphatase OS=Acetobacter pasteurianus (strain NBRC 3283 / LMG 1513 / CCTM 1153) OX=634452 GN=hisE PE=3 SV=1
MM1 pKa = 7.87PIITVVGASGNIQVTVDD18 pKa = 3.73GAQNSALYY26 pKa = 10.04NQATDD31 pKa = 4.36LSNQLSSVISTLDD44 pKa = 3.38AQNLSAGDD52 pKa = 3.71TTFSDD57 pKa = 4.07SNKK60 pKa = 10.12AGYY63 pKa = 10.04GVITSAGSYY72 pKa = 9.18RR73 pKa = 11.84VAGNVEE79 pKa = 3.96YY80 pKa = 11.0LGIGSDD86 pKa = 3.8ARR88 pKa = 11.84SQPLIALNGQVTVDD102 pKa = 3.48AVGVTSKK109 pKa = 11.26NMTILGGTNTGIAFYY124 pKa = 10.44AGSQSGQFLAGAGANLFEE142 pKa = 5.68GNSQYY147 pKa = 11.37DD148 pKa = 3.29AGNWSIMTGNGNDD161 pKa = 3.78TVNSGAGNNTISAGLGHH178 pKa = 5.91NTIDD182 pKa = 4.28LGSGMNYY189 pKa = 8.49VHH191 pKa = 7.38SDD193 pKa = 3.33GQDD196 pKa = 3.18TITATSGRR204 pKa = 11.84QSVTLSGSSSTVQLSDD220 pKa = 2.93NSLVVDD226 pKa = 4.91ANSSQQITVGGASTVTGGSLDD247 pKa = 3.89YY248 pKa = 11.07INFSGATGTVEE259 pKa = 4.47GGQNSTISAAHH270 pKa = 6.63GNLQTEE276 pKa = 4.54NTDD279 pKa = 3.24SALINVSDD287 pKa = 3.92NLTFIGGTGEE297 pKa = 4.08TTITAGHH304 pKa = 5.78ATIFGSNGLDD314 pKa = 2.93IHH316 pKa = 7.11VSASQQGTIDD326 pKa = 3.46GAGANNLFVANDD338 pKa = 3.66GNEE341 pKa = 4.25TLDD344 pKa = 3.89GASSAFGFQAFGNNAGTTGTQTFIGGTASDD374 pKa = 3.79TLVAGVGNATLEE386 pKa = 4.6GGSGAANVFGFRR398 pKa = 11.84NSVAGADD405 pKa = 3.68YY406 pKa = 9.44TIQDD410 pKa = 4.0FGSAANNSVLLVDD423 pKa = 3.86YY424 pKa = 10.2DD425 pKa = 3.71YY426 pKa = 11.63TKK428 pKa = 11.27ASFQTEE434 pKa = 4.28VLDD437 pKa = 4.39KK438 pKa = 10.32ATHH441 pKa = 6.1NGGNTTITLSDD452 pKa = 3.42HH453 pKa = 5.64SQITFVNVDD462 pKa = 3.93TLNEE466 pKa = 4.04NQFSGLKK473 pKa = 9.94
MM1 pKa = 7.87PIITVVGASGNIQVTVDD18 pKa = 3.73GAQNSALYY26 pKa = 10.04NQATDD31 pKa = 4.36LSNQLSSVISTLDD44 pKa = 3.38AQNLSAGDD52 pKa = 3.71TTFSDD57 pKa = 4.07SNKK60 pKa = 10.12AGYY63 pKa = 10.04GVITSAGSYY72 pKa = 9.18RR73 pKa = 11.84VAGNVEE79 pKa = 3.96YY80 pKa = 11.0LGIGSDD86 pKa = 3.8ARR88 pKa = 11.84SQPLIALNGQVTVDD102 pKa = 3.48AVGVTSKK109 pKa = 11.26NMTILGGTNTGIAFYY124 pKa = 10.44AGSQSGQFLAGAGANLFEE142 pKa = 5.68GNSQYY147 pKa = 11.37DD148 pKa = 3.29AGNWSIMTGNGNDD161 pKa = 3.78TVNSGAGNNTISAGLGHH178 pKa = 5.91NTIDD182 pKa = 4.28LGSGMNYY189 pKa = 8.49VHH191 pKa = 7.38SDD193 pKa = 3.33GQDD196 pKa = 3.18TITATSGRR204 pKa = 11.84QSVTLSGSSSTVQLSDD220 pKa = 2.93NSLVVDD226 pKa = 4.91ANSSQQITVGGASTVTGGSLDD247 pKa = 3.89YY248 pKa = 11.07INFSGATGTVEE259 pKa = 4.47GGQNSTISAAHH270 pKa = 6.63GNLQTEE276 pKa = 4.54NTDD279 pKa = 3.24SALINVSDD287 pKa = 3.92NLTFIGGTGEE297 pKa = 4.08TTITAGHH304 pKa = 5.78ATIFGSNGLDD314 pKa = 2.93IHH316 pKa = 7.11VSASQQGTIDD326 pKa = 3.46GAGANNLFVANDD338 pKa = 3.66GNEE341 pKa = 4.25TLDD344 pKa = 3.89GASSAFGFQAFGNNAGTTGTQTFIGGTASDD374 pKa = 3.79TLVAGVGNATLEE386 pKa = 4.6GGSGAANVFGFRR398 pKa = 11.84NSVAGADD405 pKa = 3.68YY406 pKa = 9.44TIQDD410 pKa = 4.0FGSAANNSVLLVDD423 pKa = 3.86YY424 pKa = 10.2DD425 pKa = 3.71YY426 pKa = 11.63TKK428 pKa = 11.27ASFQTEE434 pKa = 4.28VLDD437 pKa = 4.39KK438 pKa = 10.32ATHH441 pKa = 6.1NGGNTTITLSDD452 pKa = 3.42HH453 pKa = 5.64SQITFVNVDD462 pKa = 3.93TLNEE466 pKa = 4.04NQFSGLKK473 pKa = 9.94
Molecular weight: 47.47 kDa
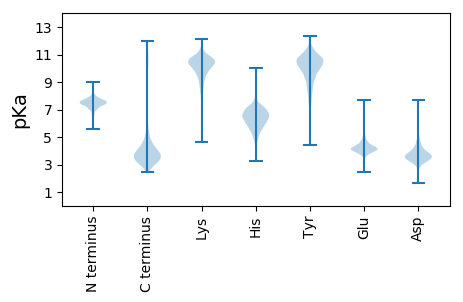
Isoelectric point according different methods:
Protein with the highest isoelectric point:
>tr|C7JEJ0|C7JEJ0_ACEP3 Uncharacterized protein OS=Acetobacter pasteurianus (strain NBRC 3283 / LMG 1513 / CCTM 1153) OX=634452 GN=APA01_06710 PE=4 SV=1
MM1 pKa = 7.35KK2 pKa = 9.4RR3 pKa = 11.84TYY5 pKa = 10.2QPSRR9 pKa = 11.84LVRR12 pKa = 11.84KK13 pKa = 9.21RR14 pKa = 11.84RR15 pKa = 11.84HH16 pKa = 4.48GFRR19 pKa = 11.84ARR21 pKa = 11.84MATVGGRR28 pKa = 11.84KK29 pKa = 9.03IIGNRR34 pKa = 11.84RR35 pKa = 11.84SKK37 pKa = 10.41GRR39 pKa = 11.84KK40 pKa = 8.72RR41 pKa = 11.84LSAA44 pKa = 3.96
MM1 pKa = 7.35KK2 pKa = 9.4RR3 pKa = 11.84TYY5 pKa = 10.2QPSRR9 pKa = 11.84LVRR12 pKa = 11.84KK13 pKa = 9.21RR14 pKa = 11.84RR15 pKa = 11.84HH16 pKa = 4.48GFRR19 pKa = 11.84ARR21 pKa = 11.84MATVGGRR28 pKa = 11.84KK29 pKa = 9.03IIGNRR34 pKa = 11.84RR35 pKa = 11.84SKK37 pKa = 10.41GRR39 pKa = 11.84KK40 pKa = 8.72RR41 pKa = 11.84LSAA44 pKa = 3.96
Molecular weight: 5.2 kDa
Isoelectric point according different methods:
Peptides (in silico digests for buttom-up proteomics)
Below you can find in silico digests of the whole proteome with Trypsin, Chymotrypsin, Trypsin+LysC, LysN, ArgC proteases suitable for different mass spec machines.| Try ESI |
 |
|---|
| ChTry ESI |
 |
|---|
| ArgC ESI |
 |
|---|
| LysN ESI |
 |
|---|
| TryLysC ESI |
 |
|---|
| Try MALDI |
 |
|---|
| ChTry MALDI |
 |
|---|
| ArgC MALDI |
 |
|---|
| LysN MALDI |
 |
|---|
| TryLysC MALDI |
 |
|---|
| Try LTQ |
 |
|---|
| ChTry LTQ |
 |
|---|
| ArgC LTQ |
 |
|---|
| LysN LTQ |
 |
|---|
| TryLysC LTQ |
 |
|---|
| Try MSlow |
 |
|---|
| ChTry MSlow |
 |
|---|
| ArgC MSlow |
 |
|---|
| LysN MSlow |
 |
|---|
| TryLysC MSlow |
 |
|---|
| Try MShigh |
 |
|---|
| ChTry MShigh |
 |
|---|
| ArgC MShigh |
 |
|---|
| LysN MShigh |
 |
|---|
| TryLysC MShigh |
 |
|---|
General Statistics
Number of major isoforms |
Number of additional isoforms |
Number of all proteins |
Number of amino acids |
Min. Seq. Length |
Max. Seq. Length |
Avg. Seq. Length |
Avg. Mol. Weight |
|---|---|---|---|---|---|---|---|
0 |
941337 |
26 |
2008 |
323.9 |
35.37 |
Amino acid frequency
Ala |
Cys |
Asp |
Glu |
Phe |
Gly |
His |
Ile |
Lys |
Leu |
|---|---|---|---|---|---|---|---|---|---|
11.331 ± 0.053 | 1.135 ± 0.016 |
5.226 ± 0.035 | 5.313 ± 0.057 |
3.64 ± 0.03 | 8.019 ± 0.05 |
2.464 ± 0.023 | 5.072 ± 0.034 |
3.637 ± 0.035 | 10.178 ± 0.056 |
Met |
Asn |
Gln |
Pro |
Arg |
Ser |
Thr |
Val |
Trp |
Tyr |
|---|---|---|---|---|---|---|---|---|---|
2.621 ± 0.022 | 3.062 ± 0.033 |
5.389 ± 0.041 | 3.95 ± 0.03 |
6.453 ± 0.051 | 5.799 ± 0.035 |
5.75 ± 0.038 | 7.138 ± 0.041 |
1.455 ± 0.019 | 2.367 ± 0.027 |
Most of the basic statistics you can see at this page can be downloaded from this CSV file
Proteome-pI is available under Creative Commons Attribution-NoDerivs license, for more details see here
| Reference: Kozlowski LP. Proteome-pI 2.0: Proteome Isoelectric Point Database Update. Nucleic Acids Res. 2021, doi: 10.1093/nar/gkab944 | Contact: Lukasz P. Kozlowski |
