Gordonia phage TimTam
Taxonomy: Viruses; Duplodnaviria; Heunggongvirae; Uroviricota; Caudoviricetes; Caudovirales; Siphoviridae; Nymbaxtervirinae; Nymphadoravirus; unclassified Nymphadoravirus
Average proteome isoelectric point is 6.45
Get precalculated fractions of proteins

Virtual 2D-PAGE plot for 82 proteins (isoelectric point calculated using IPC2_protein)
Get csv file with sequences according to given criteria:
* You can choose from 21 different methods for calculating isoelectric point
Summary statistics related to proteome-wise predictions


Protein with the lowest isoelectric point:
>tr|A0A516KPB3|A0A516KPB3_9CAUD Helix-turn-helix DNA binding domain protein OS=Gordonia phage TimTam OX=2250398 GN=79 PE=4 SV=1
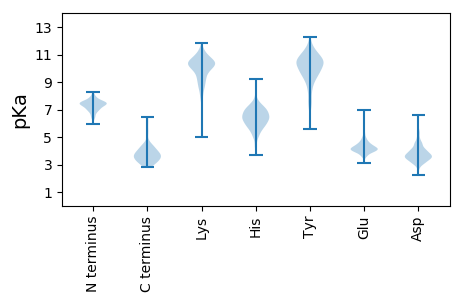
MM1 pKa = 7.33LASVTLSNPACSYY14 pKa = 7.47TTALPPGYY22 pKa = 10.65VSVDD26 pKa = 3.07PSANVTVTVPLKK38 pKa = 11.14VFTTSLMGWSLPHH51 pKa = 5.8EE52 pKa = 4.47TALGCPSIEE61 pKa = 4.29GPSMADD67 pKa = 3.36CYY69 pKa = 11.4VVDD72 pKa = 5.01FAHH75 pKa = 6.92RR76 pKa = 11.84RR77 pKa = 11.84DD78 pKa = 3.9GGPPLIGPFDD88 pKa = 3.94DD89 pKa = 4.06QIEE92 pKa = 4.01ARR94 pKa = 11.84EE95 pKa = 4.08AGRR98 pKa = 11.84SAKK101 pKa = 10.29AGRR104 pKa = 11.84FDD106 pKa = 3.28IRR108 pKa = 11.84TVYY111 pKa = 10.5PPDD114 pKa = 3.57ATDD117 pKa = 3.13ITPAVDD123 pKa = 3.81PWASSDD129 pKa = 4.47GGDD132 pKa = 3.21TT133 pKa = 3.93
MM1 pKa = 7.33LASVTLSNPACSYY14 pKa = 7.47TTALPPGYY22 pKa = 10.65VSVDD26 pKa = 3.07PSANVTVTVPLKK38 pKa = 11.14VFTTSLMGWSLPHH51 pKa = 5.8EE52 pKa = 4.47TALGCPSIEE61 pKa = 4.29GPSMADD67 pKa = 3.36CYY69 pKa = 11.4VVDD72 pKa = 5.01FAHH75 pKa = 6.92RR76 pKa = 11.84RR77 pKa = 11.84DD78 pKa = 3.9GGPPLIGPFDD88 pKa = 3.94DD89 pKa = 4.06QIEE92 pKa = 4.01ARR94 pKa = 11.84EE95 pKa = 4.08AGRR98 pKa = 11.84SAKK101 pKa = 10.29AGRR104 pKa = 11.84FDD106 pKa = 3.28IRR108 pKa = 11.84TVYY111 pKa = 10.5PPDD114 pKa = 3.57ATDD117 pKa = 3.13ITPAVDD123 pKa = 3.81PWASSDD129 pKa = 4.47GGDD132 pKa = 3.21TT133 pKa = 3.93
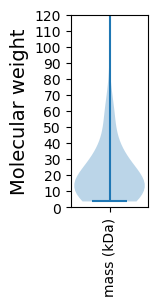
Molecular weight: 13.96 kDa
Isoelectric point according different methods:
Protein with the highest isoelectric point:
>tr|A0A516KP83|A0A516KP83_9CAUD Terminase large subunit OS=Gordonia phage TimTam OX=2250398 GN=2 PE=4 SV=1
MM1 pKa = 7.52GFTSRR6 pKa = 11.84SMYY9 pKa = 11.12AEE11 pKa = 4.07VDD13 pKa = 2.84LDD15 pKa = 3.41MFMRR19 pKa = 11.84ALRR22 pKa = 11.84RR23 pKa = 11.84SGMSYY28 pKa = 10.52QEE30 pKa = 4.47LADD33 pKa = 3.58EE34 pKa = 4.56ATRR37 pKa = 11.84EE38 pKa = 3.91LRR40 pKa = 11.84KK41 pKa = 9.31IARR44 pKa = 11.84SEE46 pKa = 3.81RR47 pKa = 11.84RR48 pKa = 11.84KK49 pKa = 9.96RR50 pKa = 11.84RR51 pKa = 11.84PDD53 pKa = 3.27NVPAGVSKK61 pKa = 10.98ALIGQIVNGAAKK73 pKa = 8.95STHH76 pKa = 5.73EE77 pKa = 4.0LRR79 pKa = 11.84GLAIEE84 pKa = 4.5RR85 pKa = 11.84ALEE88 pKa = 4.03VSDD91 pKa = 4.52GDD93 pKa = 3.95LFVPRR98 pKa = 11.84VVRR101 pKa = 11.84GSGTTNRR108 pKa = 11.84RR109 pKa = 11.84VASS112 pKa = 3.73
MM1 pKa = 7.52GFTSRR6 pKa = 11.84SMYY9 pKa = 11.12AEE11 pKa = 4.07VDD13 pKa = 2.84LDD15 pKa = 3.41MFMRR19 pKa = 11.84ALRR22 pKa = 11.84RR23 pKa = 11.84SGMSYY28 pKa = 10.52QEE30 pKa = 4.47LADD33 pKa = 3.58EE34 pKa = 4.56ATRR37 pKa = 11.84EE38 pKa = 3.91LRR40 pKa = 11.84KK41 pKa = 9.31IARR44 pKa = 11.84SEE46 pKa = 3.81RR47 pKa = 11.84RR48 pKa = 11.84KK49 pKa = 9.96RR50 pKa = 11.84RR51 pKa = 11.84PDD53 pKa = 3.27NVPAGVSKK61 pKa = 10.98ALIGQIVNGAAKK73 pKa = 8.95STHH76 pKa = 5.73EE77 pKa = 4.0LRR79 pKa = 11.84GLAIEE84 pKa = 4.5RR85 pKa = 11.84ALEE88 pKa = 4.03VSDD91 pKa = 4.52GDD93 pKa = 3.95LFVPRR98 pKa = 11.84VVRR101 pKa = 11.84GSGTTNRR108 pKa = 11.84RR109 pKa = 11.84VASS112 pKa = 3.73
Molecular weight: 12.47 kDa
Isoelectric point according different methods:
Peptides (in silico digests for buttom-up proteomics)
Below you can find in silico digests of the whole proteome with Trypsin, Chymotrypsin, Trypsin+LysC, LysN, ArgC proteases suitable for different mass spec machines.| Try ESI |
 |
|---|
| ChTry ESI |
 |
|---|
| ArgC ESI |
 |
|---|
| LysN ESI |
 |
|---|
| TryLysC ESI |
 |
|---|
| Try MALDI |
 |
|---|
| ChTry MALDI |
 |
|---|
| ArgC MALDI |
 |
|---|
| LysN MALDI |
 |
|---|
| TryLysC MALDI |
 |
|---|
| Try LTQ |
 |
|---|
| ChTry LTQ |
 |
|---|
| ArgC LTQ |
 |
|---|
| LysN LTQ |
 |
|---|
| TryLysC LTQ |
 |
|---|
| Try MSlow |
 |
|---|
| ChTry MSlow |
 |
|---|
| ArgC MSlow |
 |
|---|
| LysN MSlow |
 |
|---|
| TryLysC MSlow |
 |
|---|
| Try MShigh |
 |
|---|
| ChTry MShigh |
 |
|---|
| ArgC MShigh |
 |
|---|
| LysN MShigh |
 |
|---|
| TryLysC MShigh |
 |
|---|
General Statistics
Number of major isoforms |
Number of additional isoforms |
Number of all proteins |
Number of amino acids |
Min. Seq. Length |
Max. Seq. Length |
Avg. Seq. Length |
Avg. Mol. Weight |
|---|---|---|---|---|---|---|---|
0 |
17187 |
32 |
2142 |
209.6 |
22.82 |
Amino acid frequency
Ala |
Cys |
Asp |
Glu |
Phe |
Gly |
His |
Ile |
Lys |
Leu |
|---|---|---|---|---|---|---|---|---|---|
11.928 ± 0.616 | 0.826 ± 0.159 |
7.005 ± 0.359 | 5.696 ± 0.294 |
2.653 ± 0.178 | 8.483 ± 0.337 |
1.978 ± 0.168 | 4.486 ± 0.179 |
3.183 ± 0.196 | 7.57 ± 0.264 |
Met |
Asn |
Gln |
Pro |
Arg |
Ser |
Thr |
Val |
Trp |
Tyr |
|---|---|---|---|---|---|---|---|---|---|
2.083 ± 0.177 | 2.95 ± 0.185 |
5.673 ± 0.268 | 3.66 ± 0.273 |
7.866 ± 0.438 | 5.382 ± 0.221 |
7.18 ± 0.343 | 7.337 ± 0.228 |
1.955 ± 0.13 | 2.106 ± 0.124 |
Most of the basic statistics you can see at this page can be downloaded from this CSV file
Proteome-pI is available under Creative Commons Attribution-NoDerivs license, for more details see here
| Reference: Kozlowski LP. Proteome-pI 2.0: Proteome Isoelectric Point Database Update. Nucleic Acids Res. 2021, doi: 10.1093/nar/gkab944 | Contact: Lukasz P. Kozlowski |
