Reinekea blandensis MED297
Taxonomy: cellular organisms; Bacteria; Proteobacteria; Gammaproteobacteria; Oceanospirillales; Saccharospirillaceae; Reinekea; Reinekea blandensis
Average proteome isoelectric point is 5.9
Get precalculated fractions of proteins

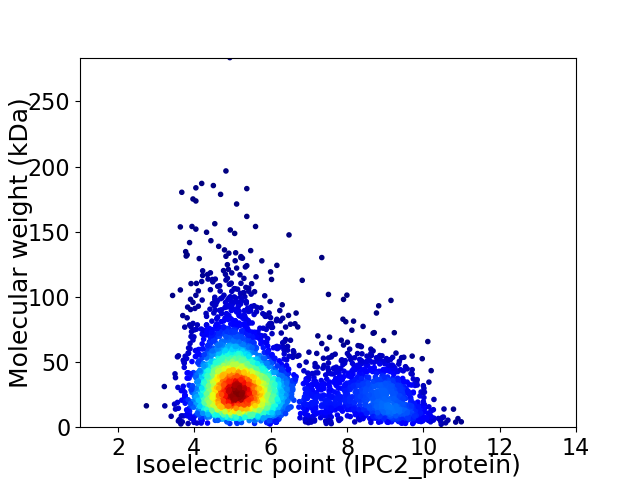
Virtual 2D-PAGE plot for 4236 proteins (isoelectric point calculated using IPC2_protein)
Get csv file with sequences according to given criteria:
* You can choose from 21 different methods for calculating isoelectric point
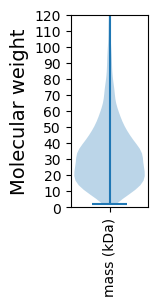
Summary statistics related to proteome-wise predictions


Protein with the lowest isoelectric point:
>tr|A4BKL8|A4BKL8_9GAMM Apolipoprotein N-acyltransferase OS=Reinekea blandensis MED297 OX=314283 GN=lnt PE=3 SV=1
MM1 pKa = 7.5KK2 pKa = 10.65KK3 pKa = 10.45LMTIAGVAIALTACGPEE20 pKa = 4.35GSSSYY25 pKa = 11.6DD26 pKa = 3.12LTFKK30 pKa = 9.75ITEE33 pKa = 4.13ANAKK37 pKa = 9.66NVIANSVTLTEE48 pKa = 4.73DD49 pKa = 3.1TDD51 pKa = 3.76EE52 pKa = 4.21YY53 pKa = 10.6TPSKK57 pKa = 10.2MLEE60 pKa = 4.35SYY62 pKa = 10.32SAPTTAIQSRR72 pKa = 11.84ASQSVTLDD80 pKa = 3.57CSPSGTMTLSATVPDD95 pKa = 4.67SYY97 pKa = 11.77ANTGDD102 pKa = 4.41LPTSGQMSVSTTFNNCDD119 pKa = 4.2DD120 pKa = 3.77GWEE123 pKa = 4.21VTDD126 pKa = 4.12GGMSVSMSWSGYY138 pKa = 8.99NEE140 pKa = 4.44SNDD143 pKa = 3.73TYY145 pKa = 11.68NSLTVGIDD153 pKa = 3.27FDD155 pKa = 4.43DD156 pKa = 5.2FKK158 pKa = 11.29VTADD162 pKa = 3.95GEE164 pKa = 4.52TSKK167 pKa = 10.69IDD169 pKa = 3.35GGLDD173 pKa = 2.76ISTGSTSQSVSWDD186 pKa = 3.37LYY188 pKa = 10.22SQFNGQTLRR197 pKa = 11.84TSTPQAISIGLNDD210 pKa = 4.58TYY212 pKa = 11.03PSAGVIRR219 pKa = 11.84VEE221 pKa = 4.44GADD224 pKa = 3.52DD225 pKa = 3.55TFAEE229 pKa = 4.46AKK231 pKa = 9.63IVPNGYY237 pKa = 9.37EE238 pKa = 3.87VTVNGGQATLYY249 pKa = 9.78TWDD252 pKa = 3.33QFF254 pKa = 3.96
MM1 pKa = 7.5KK2 pKa = 10.65KK3 pKa = 10.45LMTIAGVAIALTACGPEE20 pKa = 4.35GSSSYY25 pKa = 11.6DD26 pKa = 3.12LTFKK30 pKa = 9.75ITEE33 pKa = 4.13ANAKK37 pKa = 9.66NVIANSVTLTEE48 pKa = 4.73DD49 pKa = 3.1TDD51 pKa = 3.76EE52 pKa = 4.21YY53 pKa = 10.6TPSKK57 pKa = 10.2MLEE60 pKa = 4.35SYY62 pKa = 10.32SAPTTAIQSRR72 pKa = 11.84ASQSVTLDD80 pKa = 3.57CSPSGTMTLSATVPDD95 pKa = 4.67SYY97 pKa = 11.77ANTGDD102 pKa = 4.41LPTSGQMSVSTTFNNCDD119 pKa = 4.2DD120 pKa = 3.77GWEE123 pKa = 4.21VTDD126 pKa = 4.12GGMSVSMSWSGYY138 pKa = 8.99NEE140 pKa = 4.44SNDD143 pKa = 3.73TYY145 pKa = 11.68NSLTVGIDD153 pKa = 3.27FDD155 pKa = 4.43DD156 pKa = 5.2FKK158 pKa = 11.29VTADD162 pKa = 3.95GEE164 pKa = 4.52TSKK167 pKa = 10.69IDD169 pKa = 3.35GGLDD173 pKa = 2.76ISTGSTSQSVSWDD186 pKa = 3.37LYY188 pKa = 10.22SQFNGQTLRR197 pKa = 11.84TSTPQAISIGLNDD210 pKa = 4.58TYY212 pKa = 11.03PSAGVIRR219 pKa = 11.84VEE221 pKa = 4.44GADD224 pKa = 3.52DD225 pKa = 3.55TFAEE229 pKa = 4.46AKK231 pKa = 9.63IVPNGYY237 pKa = 9.37EE238 pKa = 3.87VTVNGGQATLYY249 pKa = 9.78TWDD252 pKa = 3.33QFF254 pKa = 3.96
Molecular weight: 26.84 kDa
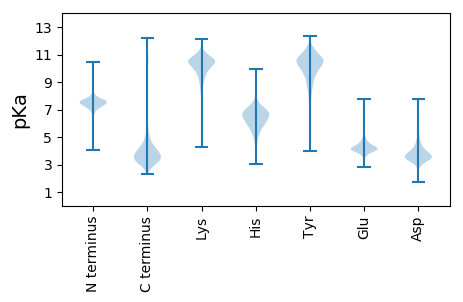
Isoelectric point according different methods:
Protein with the highest isoelectric point:
>tr|A4BDB7|A4BDB7_9GAMM Uncharacterized protein OS=Reinekea blandensis MED297 OX=314283 GN=MED297_05914 PE=4 SV=1
MM1 pKa = 7.81LFQLSNLKK9 pKa = 10.32EE10 pKa = 3.69IGIMKK15 pKa = 9.22RR16 pKa = 11.84TFQPSNLKK24 pKa = 10.14RR25 pKa = 11.84KK26 pKa = 8.92RR27 pKa = 11.84SHH29 pKa = 6.09GFRR32 pKa = 11.84SRR34 pKa = 11.84MATKK38 pKa = 10.46NGRR41 pKa = 11.84KK42 pKa = 8.96VLARR46 pKa = 11.84RR47 pKa = 11.84RR48 pKa = 11.84ARR50 pKa = 11.84GRR52 pKa = 11.84ASLSAA57 pKa = 3.92
MM1 pKa = 7.81LFQLSNLKK9 pKa = 10.32EE10 pKa = 3.69IGIMKK15 pKa = 9.22RR16 pKa = 11.84TFQPSNLKK24 pKa = 10.14RR25 pKa = 11.84KK26 pKa = 8.92RR27 pKa = 11.84SHH29 pKa = 6.09GFRR32 pKa = 11.84SRR34 pKa = 11.84MATKK38 pKa = 10.46NGRR41 pKa = 11.84KK42 pKa = 8.96VLARR46 pKa = 11.84RR47 pKa = 11.84RR48 pKa = 11.84ARR50 pKa = 11.84GRR52 pKa = 11.84ASLSAA57 pKa = 3.92
Molecular weight: 6.61 kDa
Isoelectric point according different methods:
Peptides (in silico digests for buttom-up proteomics)
Below you can find in silico digests of the whole proteome with Trypsin, Chymotrypsin, Trypsin+LysC, LysN, ArgC proteases suitable for different mass spec machines.| Try ESI |
 |
|---|
| ChTry ESI |
 |
|---|
| ArgC ESI |
 |
|---|
| LysN ESI |
 |
|---|
| TryLysC ESI |
 |
|---|
| Try MALDI |
 |
|---|
| ChTry MALDI |
 |
|---|
| ArgC MALDI |
 |
|---|
| LysN MALDI |
 |
|---|
| TryLysC MALDI |
 |
|---|
| Try LTQ |
 |
|---|
| ChTry LTQ |
 |
|---|
| ArgC LTQ |
 |
|---|
| LysN LTQ |
 |
|---|
| TryLysC LTQ |
 |
|---|
| Try MSlow |
 |
|---|
| ChTry MSlow |
 |
|---|
| ArgC MSlow |
 |
|---|
| LysN MSlow |
 |
|---|
| TryLysC MSlow |
 |
|---|
| Try MShigh |
 |
|---|
| ChTry MShigh |
 |
|---|
| ArgC MShigh |
 |
|---|
| LysN MShigh |
 |
|---|
| TryLysC MShigh |
 |
|---|
General Statistics
Number of major isoforms |
Number of additional isoforms |
Number of all proteins |
Number of amino acids |
Min. Seq. Length |
Max. Seq. Length |
Avg. Seq. Length |
Avg. Mol. Weight |
|---|---|---|---|---|---|---|---|
0 |
1345410 |
21 |
2587 |
317.6 |
35.26 |
Amino acid frequency
Ala |
Cys |
Asp |
Glu |
Phe |
Gly |
His |
Ile |
Lys |
Leu |
|---|---|---|---|---|---|---|---|---|---|
9.18 ± 0.036 | 0.89 ± 0.013 |
6.154 ± 0.033 | 6.124 ± 0.035 |
4.033 ± 0.022 | 6.957 ± 0.038 |
2.302 ± 0.021 | 5.57 ± 0.033 |
3.678 ± 0.035 | 10.778 ± 0.045 |
Met |
Asn |
Gln |
Pro |
Arg |
Ser |
Thr |
Val |
Trp |
Tyr |
|---|---|---|---|---|---|---|---|---|---|
2.52 ± 0.018 | 3.663 ± 0.024 |
4.31 ± 0.024 | 4.834 ± 0.034 |
5.591 ± 0.033 | 6.388 ± 0.035 |
5.635 ± 0.031 | 7.085 ± 0.028 |
1.479 ± 0.016 | 2.829 ± 0.021 |
Most of the basic statistics you can see at this page can be downloaded from this CSV file
Proteome-pI is available under Creative Commons Attribution-NoDerivs license, for more details see here
| Reference: Kozlowski LP. Proteome-pI 2.0: Proteome Isoelectric Point Database Update. Nucleic Acids Res. 2021, doi: 10.1093/nar/gkab944 | Contact: Lukasz P. Kozlowski |
