Clerodendron golden mosaic virus
Taxonomy: Viruses; Monodnaviria; Shotokuvirae; Cressdnaviricota; Repensiviricetes; Geplafuvirales; Geminiviridae; Begomovirus
Average proteome isoelectric point is 8.09
Get precalculated fractions of proteins

Virtual 2D-PAGE plot for 8 proteins (isoelectric point calculated using IPC2_protein)
Get csv file with sequences according to given criteria:
* You can choose from 21 different methods for calculating isoelectric point
Summary statistics related to proteome-wise predictions


Protein with the lowest isoelectric point:
>tr|A5H161|A5H161_9GEMI Nuclear shuttle protein OS=Clerodendron golden mosaic virus OX=390438 GN=BV1 PE=3 SV=1
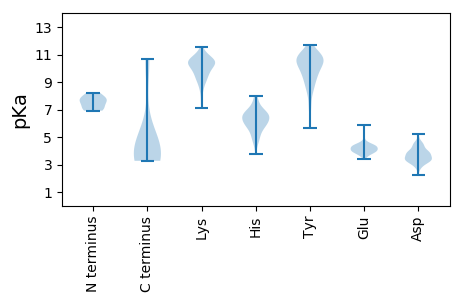
MM1 pKa = 7.01LTSHH5 pKa = 7.01TGLSDD10 pKa = 2.92MWDD13 pKa = 3.41PLVNDD18 pKa = 4.5FPEE21 pKa = 4.69TVHH24 pKa = 7.1GLRR27 pKa = 11.84CMLAVKK33 pKa = 9.32YY34 pKa = 10.21LKK36 pKa = 10.48YY37 pKa = 10.79VEE39 pKa = 4.49STYY42 pKa = 11.35SPDD45 pKa = 3.14TLGYY49 pKa = 10.84DD50 pKa = 4.78LIRR53 pKa = 11.84DD54 pKa = 4.52LILVVRR60 pKa = 11.84AKK62 pKa = 10.88NYY64 pKa = 9.84GEE66 pKa = 3.59ASRR69 pKa = 11.84RR70 pKa = 11.84YY71 pKa = 8.44NHH73 pKa = 6.23FHH75 pKa = 6.26TRR77 pKa = 11.84LQGSTEE83 pKa = 3.94AEE85 pKa = 3.74LRR87 pKa = 11.84QPVSEE92 pKa = 4.49PCACPHH98 pKa = 6.68CPRR101 pKa = 11.84HH102 pKa = 5.62TKK104 pKa = 9.12TVMGQSAHH112 pKa = 4.79VQEE115 pKa = 4.92AQDD118 pKa = 3.2II119 pKa = 4.06
MM1 pKa = 7.01LTSHH5 pKa = 7.01TGLSDD10 pKa = 2.92MWDD13 pKa = 3.41PLVNDD18 pKa = 4.5FPEE21 pKa = 4.69TVHH24 pKa = 7.1GLRR27 pKa = 11.84CMLAVKK33 pKa = 9.32YY34 pKa = 10.21LKK36 pKa = 10.48YY37 pKa = 10.79VEE39 pKa = 4.49STYY42 pKa = 11.35SPDD45 pKa = 3.14TLGYY49 pKa = 10.84DD50 pKa = 4.78LIRR53 pKa = 11.84DD54 pKa = 4.52LILVVRR60 pKa = 11.84AKK62 pKa = 10.88NYY64 pKa = 9.84GEE66 pKa = 3.59ASRR69 pKa = 11.84RR70 pKa = 11.84YY71 pKa = 8.44NHH73 pKa = 6.23FHH75 pKa = 6.26TRR77 pKa = 11.84LQGSTEE83 pKa = 3.94AEE85 pKa = 3.74LRR87 pKa = 11.84QPVSEE92 pKa = 4.49PCACPHH98 pKa = 6.68CPRR101 pKa = 11.84HH102 pKa = 5.62TKK104 pKa = 9.12TVMGQSAHH112 pKa = 4.79VQEE115 pKa = 4.92AQDD118 pKa = 3.2II119 pKa = 4.06
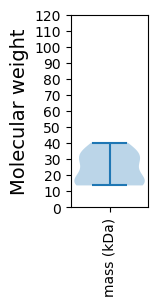
Molecular weight: 13.55 kDa
Isoelectric point according different methods:
Protein with the highest isoelectric point:
>tr|A5H160|A5H160_9GEMI Protein V2 OS=Clerodendron golden mosaic virus OX=390438 GN=AV2 PE=3 SV=1
MM1 pKa = 7.62PKK3 pKa = 9.84IIFSLIHH10 pKa = 6.02NAHH13 pKa = 5.11SQKK16 pKa = 10.84KK17 pKa = 9.76KK18 pKa = 10.18LLPDD22 pKa = 3.9FWQLLHH28 pKa = 6.62QPIKK32 pKa = 10.15NSSRR36 pKa = 11.84FAEE39 pKa = 4.45NSTKK43 pKa = 9.92MGALISTFLCNSRR56 pKa = 11.84ANSNARR62 pKa = 11.84INDD65 pKa = 3.25SSIWYY70 pKa = 6.72PQQDD74 pKa = 3.87QPTSILTFKK83 pKa = 10.22GQNRR87 pKa = 11.84VPTSSPIWIRR97 pKa = 11.84TGTHH101 pKa = 4.79WNGEE105 pKa = 4.27NSRR108 pKa = 11.84STGDD112 pKa = 3.23LHH114 pKa = 8.01EE115 pKa = 4.55EE116 pKa = 3.92VHH118 pKa = 6.05RR119 pKa = 11.84QLMMLTPRR127 pKa = 11.84RR128 pKa = 11.84LTLAVSTKK136 pKa = 10.53LLRR139 pKa = 11.84SLKK142 pKa = 10.43NN143 pKa = 3.27
MM1 pKa = 7.62PKK3 pKa = 9.84IIFSLIHH10 pKa = 6.02NAHH13 pKa = 5.11SQKK16 pKa = 10.84KK17 pKa = 9.76KK18 pKa = 10.18LLPDD22 pKa = 3.9FWQLLHH28 pKa = 6.62QPIKK32 pKa = 10.15NSSRR36 pKa = 11.84FAEE39 pKa = 4.45NSTKK43 pKa = 9.92MGALISTFLCNSRR56 pKa = 11.84ANSNARR62 pKa = 11.84INDD65 pKa = 3.25SSIWYY70 pKa = 6.72PQQDD74 pKa = 3.87QPTSILTFKK83 pKa = 10.22GQNRR87 pKa = 11.84VPTSSPIWIRR97 pKa = 11.84TGTHH101 pKa = 4.79WNGEE105 pKa = 4.27NSRR108 pKa = 11.84STGDD112 pKa = 3.23LHH114 pKa = 8.01EE115 pKa = 4.55EE116 pKa = 3.92VHH118 pKa = 6.05RR119 pKa = 11.84QLMMLTPRR127 pKa = 11.84RR128 pKa = 11.84LTLAVSTKK136 pKa = 10.53LLRR139 pKa = 11.84SLKK142 pKa = 10.43NN143 pKa = 3.27
Molecular weight: 16.41 kDa
Isoelectric point according different methods:
Peptides (in silico digests for buttom-up proteomics)
Below you can find in silico digests of the whole proteome with Trypsin, Chymotrypsin, Trypsin+LysC, LysN, ArgC proteases suitable for different mass spec machines.| Try ESI |
 |
|---|
| ChTry ESI |
 |
|---|
| ArgC ESI |
 |
|---|
| LysN ESI |
 |
|---|
| TryLysC ESI |
 |
|---|
| Try MALDI |
 |
|---|
| ChTry MALDI |
 |
|---|
| ArgC MALDI |
 |
|---|
| LysN MALDI |
 |
|---|
| TryLysC MALDI |
 |
|---|
| Try LTQ |
 |
|---|
| ChTry LTQ |
 |
|---|
| ArgC LTQ |
 |
|---|
| LysN LTQ |
 |
|---|
| TryLysC LTQ |
 |
|---|
| Try MSlow |
 |
|---|
| ChTry MSlow |
 |
|---|
| ArgC MSlow |
 |
|---|
| LysN MSlow |
 |
|---|
| TryLysC MSlow |
 |
|---|
| Try MShigh |
 |
|---|
| ChTry MShigh |
 |
|---|
| ArgC MShigh |
 |
|---|
| LysN MShigh |
 |
|---|
| TryLysC MShigh |
 |
|---|
General Statistics
Number of major isoforms |
Number of additional isoforms |
Number of all proteins |
Number of amino acids |
Min. Seq. Length |
Max. Seq. Length |
Avg. Seq. Length |
Avg. Mol. Weight |
|---|---|---|---|---|---|---|---|
0 |
1700 |
119 |
355 |
212.5 |
24.29 |
Amino acid frequency
Ala |
Cys |
Asp |
Glu |
Phe |
Gly |
His |
Ile |
Lys |
Leu |
|---|---|---|---|---|---|---|---|---|---|
5.176 ± 0.504 | 1.882 ± 0.208 |
4.647 ± 0.496 | 4.0 ± 0.479 |
4.294 ± 0.406 | 4.941 ± 0.243 |
3.647 ± 0.825 | 5.941 ± 0.719 |
5.059 ± 0.602 | 7.412 ± 0.726 |
Met |
Asn |
Gln |
Pro |
Arg |
Ser |
Thr |
Val |
Trp |
Tyr |
|---|---|---|---|---|---|---|---|---|---|
1.824 ± 0.231 | 5.824 ± 0.605 |
5.529 ± 0.337 | 4.353 ± 0.476 |
7.529 ± 0.952 | 9.059 ± 1.188 |
6.765 ± 0.335 | 6.529 ± 0.934 |
1.294 ± 0.186 | 4.294 ± 0.698 |
Most of the basic statistics you can see at this page can be downloaded from this CSV file
Proteome-pI is available under Creative Commons Attribution-NoDerivs license, for more details see here
| Reference: Kozlowski LP. Proteome-pI 2.0: Proteome Isoelectric Point Database Update. Nucleic Acids Res. 2021, doi: 10.1093/nar/gkab944 | Contact: Lukasz P. Kozlowski |
