Cymbidium mosaic virus
Taxonomy: Viruses; Riboviria; Orthornavirae; Kitrinoviricota; Alsuviricetes; Tymovirales; Alphaflexiviridae; Potexvirus
Average proteome isoelectric point is 6.77
Get precalculated fractions of proteins

Virtual 2D-PAGE plot for 5 proteins (isoelectric point calculated using IPC2_protein)
Get csv file with sequences according to given criteria:
* You can choose from 21 different methods for calculating isoelectric point
Summary statistics related to proteome-wise predictions


Protein with the lowest isoelectric point:
>tr|O10690|O10690_9VIRU Movement protein TGBp3 OS=Cymbidium mosaic virus OX=12178 GN=TGB 2 PE=3 SV=1
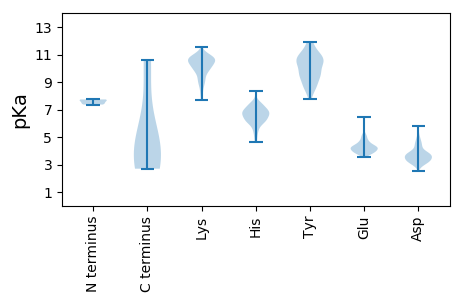
MM1 pKa = 7.36EE2 pKa = 5.28LAYY5 pKa = 10.42LVRR8 pKa = 11.84LLEE11 pKa = 4.26HH12 pKa = 6.58NKK14 pKa = 9.78FEE16 pKa = 4.37RR17 pKa = 11.84TNLPLSSPLVVHH29 pKa = 7.05GIAGSGKK36 pKa = 8.17STILTTFHH44 pKa = 6.21HH45 pKa = 7.35HH46 pKa = 5.79YY47 pKa = 8.85PAYY50 pKa = 9.7PIFSHH55 pKa = 6.81SPTLLDD61 pKa = 3.67PSNRR65 pKa = 11.84IYY67 pKa = 9.56QQCITTDD74 pKa = 3.4WVPGGAIVDD83 pKa = 4.0EE84 pKa = 4.58YY85 pKa = 11.45NYY87 pKa = 10.79KK88 pKa = 10.48ALDD91 pKa = 3.6YY92 pKa = 10.45SRR94 pKa = 11.84CLAVFGDD101 pKa = 4.54PLQLPHH107 pKa = 6.95SLQPHH112 pKa = 6.27YY113 pKa = 10.6YY114 pKa = 8.96SSRR117 pKa = 11.84THH119 pKa = 7.06RR120 pKa = 11.84YY121 pKa = 8.48GPKK124 pKa = 9.2LTSLLNDD131 pKa = 4.44LFHH134 pKa = 8.33LSITSLAPVDD144 pKa = 3.99SLDD147 pKa = 3.63YY148 pKa = 10.98ADD150 pKa = 5.34PFAVDD155 pKa = 3.51PSGFTIADD163 pKa = 3.41EE164 pKa = 4.0EE165 pKa = 5.15VYY167 pKa = 11.03NFVSQQVPGTLLPLDD182 pKa = 4.12TVGLEE187 pKa = 3.95YY188 pKa = 10.93SSVSFYY194 pKa = 11.15CSDD197 pKa = 3.31LRR199 pKa = 11.84SCVVLRR205 pKa = 11.84PLSSLHH211 pKa = 6.71RR212 pKa = 11.84SHH214 pKa = 7.49PRR216 pKa = 11.84QGQPHH221 pKa = 7.12HH222 pKa = 7.04LRR224 pKa = 11.84FQCQVV229 pKa = 2.7
MM1 pKa = 7.36EE2 pKa = 5.28LAYY5 pKa = 10.42LVRR8 pKa = 11.84LLEE11 pKa = 4.26HH12 pKa = 6.58NKK14 pKa = 9.78FEE16 pKa = 4.37RR17 pKa = 11.84TNLPLSSPLVVHH29 pKa = 7.05GIAGSGKK36 pKa = 8.17STILTTFHH44 pKa = 6.21HH45 pKa = 7.35HH46 pKa = 5.79YY47 pKa = 8.85PAYY50 pKa = 9.7PIFSHH55 pKa = 6.81SPTLLDD61 pKa = 3.67PSNRR65 pKa = 11.84IYY67 pKa = 9.56QQCITTDD74 pKa = 3.4WVPGGAIVDD83 pKa = 4.0EE84 pKa = 4.58YY85 pKa = 11.45NYY87 pKa = 10.79KK88 pKa = 10.48ALDD91 pKa = 3.6YY92 pKa = 10.45SRR94 pKa = 11.84CLAVFGDD101 pKa = 4.54PLQLPHH107 pKa = 6.95SLQPHH112 pKa = 6.27YY113 pKa = 10.6YY114 pKa = 8.96SSRR117 pKa = 11.84THH119 pKa = 7.06RR120 pKa = 11.84YY121 pKa = 8.48GPKK124 pKa = 9.2LTSLLNDD131 pKa = 4.44LFHH134 pKa = 8.33LSITSLAPVDD144 pKa = 3.99SLDD147 pKa = 3.63YY148 pKa = 10.98ADD150 pKa = 5.34PFAVDD155 pKa = 3.51PSGFTIADD163 pKa = 3.41EE164 pKa = 4.0EE165 pKa = 5.15VYY167 pKa = 11.03NFVSQQVPGTLLPLDD182 pKa = 4.12TVGLEE187 pKa = 3.95YY188 pKa = 10.93SSVSFYY194 pKa = 11.15CSDD197 pKa = 3.31LRR199 pKa = 11.84SCVVLRR205 pKa = 11.84PLSSLHH211 pKa = 6.71RR212 pKa = 11.84SHH214 pKa = 7.49PRR216 pKa = 11.84QGQPHH221 pKa = 7.12HH222 pKa = 7.04LRR224 pKa = 11.84FQCQVV229 pKa = 2.7
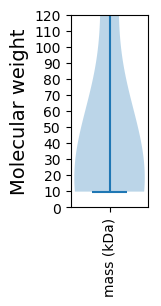
Molecular weight: 25.8 kDa
Isoelectric point according different methods:
Protein with the highest isoelectric point:
>tr|Q76SQ1|Q76SQ1_9VIRU Movement protein 2 OS=Cymbidium mosaic virus OX=12178 GN=MP2 PE=4 SV=1
MM1 pKa = 7.74PGLVPPPDD9 pKa = 3.43HH10 pKa = 6.93SKK12 pKa = 11.15SLFVLAIGITVVSALFVLKK31 pKa = 10.73SHH33 pKa = 6.93TFPIAGDD40 pKa = 3.82NIHH43 pKa = 7.03RR44 pKa = 11.84FPSGGQYY51 pKa = 10.64KK52 pKa = 10.81DD53 pKa = 3.02GTKK56 pKa = 10.14QINYY60 pKa = 8.75CPPTHH65 pKa = 6.6ARR67 pKa = 11.84YY68 pKa = 8.59PKK70 pKa = 9.87YY71 pKa = 10.04PDD73 pKa = 3.92YY74 pKa = 11.18KK75 pKa = 10.15WLAATAAIVIPLCLYY90 pKa = 10.44ISYY93 pKa = 10.51HH94 pKa = 6.14PGNNIRR100 pKa = 11.84RR101 pKa = 11.84ICPCCNTYY109 pKa = 10.14HH110 pKa = 6.8HH111 pKa = 7.31PP112 pKa = 3.99
MM1 pKa = 7.74PGLVPPPDD9 pKa = 3.43HH10 pKa = 6.93SKK12 pKa = 11.15SLFVLAIGITVVSALFVLKK31 pKa = 10.73SHH33 pKa = 6.93TFPIAGDD40 pKa = 3.82NIHH43 pKa = 7.03RR44 pKa = 11.84FPSGGQYY51 pKa = 10.64KK52 pKa = 10.81DD53 pKa = 3.02GTKK56 pKa = 10.14QINYY60 pKa = 8.75CPPTHH65 pKa = 6.6ARR67 pKa = 11.84YY68 pKa = 8.59PKK70 pKa = 9.87YY71 pKa = 10.04PDD73 pKa = 3.92YY74 pKa = 11.18KK75 pKa = 10.15WLAATAAIVIPLCLYY90 pKa = 10.44ISYY93 pKa = 10.51HH94 pKa = 6.14PGNNIRR100 pKa = 11.84RR101 pKa = 11.84ICPCCNTYY109 pKa = 10.14HH110 pKa = 6.8HH111 pKa = 7.31PP112 pKa = 3.99
Molecular weight: 12.47 kDa
Isoelectric point according different methods:
Peptides (in silico digests for buttom-up proteomics)
Below you can find in silico digests of the whole proteome with Trypsin, Chymotrypsin, Trypsin+LysC, LysN, ArgC proteases suitable for different mass spec machines.| Try ESI |
 |
|---|
| ChTry ESI |
 |
|---|
| ArgC ESI |
 |
|---|
| LysN ESI |
 |
|---|
| TryLysC ESI |
 |
|---|
| Try MALDI |
 |
|---|
| ChTry MALDI |
 |
|---|
| ArgC MALDI |
 |
|---|
| LysN MALDI |
 |
|---|
| TryLysC MALDI |
 |
|---|
| Try LTQ |
 |
|---|
| ChTry LTQ |
 |
|---|
| ArgC LTQ |
 |
|---|
| LysN LTQ |
 |
|---|
| TryLysC LTQ |
 |
|---|
| Try MSlow |
 |
|---|
| ChTry MSlow |
 |
|---|
| ArgC MSlow |
 |
|---|
| LysN MSlow |
 |
|---|
| TryLysC MSlow |
 |
|---|
| Try MShigh |
 |
|---|
| ChTry MShigh |
 |
|---|
| ArgC MShigh |
 |
|---|
| LysN MShigh |
 |
|---|
| TryLysC MShigh |
 |
|---|
General Statistics
Number of major isoforms |
Number of additional isoforms |
Number of all proteins |
Number of amino acids |
Min. Seq. Length |
Max. Seq. Length |
Avg. Seq. Length |
Avg. Mol. Weight |
|---|---|---|---|---|---|---|---|
0 |
2072 |
91 |
1417 |
414.4 |
46.35 |
Amino acid frequency
Ala |
Cys |
Asp |
Glu |
Phe |
Gly |
His |
Ile |
Lys |
Leu |
|---|---|---|---|---|---|---|---|---|---|
8.784 ± 2.246 | 1.882 ± 0.413 |
5.647 ± 0.631 | 4.778 ± 1.307 |
4.102 ± 0.141 | 4.44 ± 0.449 |
3.571 ± 0.736 | 6.129 ± 1.021 |
5.598 ± 1.42 | 9.99 ± 0.841 |
Met |
Asn |
Gln |
Pro |
Arg |
Ser |
Thr |
Val |
Trp |
Tyr |
|---|---|---|---|---|---|---|---|---|---|
1.641 ± 0.492 | 4.344 ± 0.307 |
7.432 ± 1.184 | 3.62 ± 0.568 |
4.392 ± 0.284 | 6.419 ± 0.972 |
6.998 ± 0.53 | 5.261 ± 0.314 |
1.11 ± 0.168 | 3.861 ± 0.66 |
Most of the basic statistics you can see at this page can be downloaded from this CSV file
Proteome-pI is available under Creative Commons Attribution-NoDerivs license, for more details see here
| Reference: Kozlowski LP. Proteome-pI 2.0: Proteome Isoelectric Point Database Update. Nucleic Acids Res. 2021, doi: 10.1093/nar/gkab944 | Contact: Lukasz P. Kozlowski |
