Rhodovarius sp. CCP-6
Taxonomy: cellular organisms; Bacteria; Proteobacteria; Alphaproteobacteria; Rhodospirillales; Acetobacteraceae; Rhodovarius; unclassified Rhodovarius
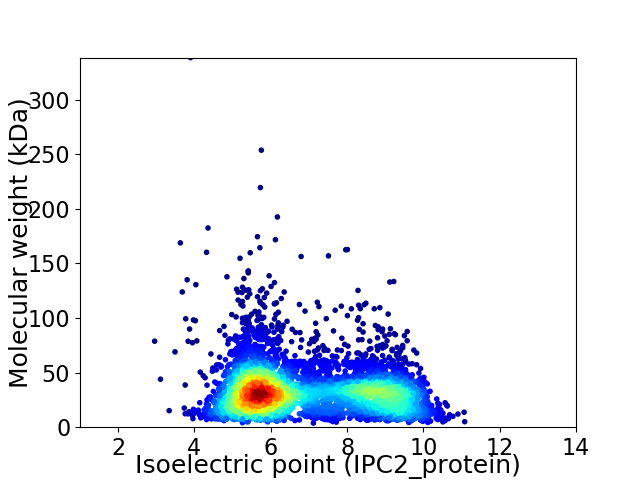
Average proteome isoelectric point is 6.91
Get precalculated fractions of proteins

Virtual 2D-PAGE plot for 5028 proteins (isoelectric point calculated using IPC2_protein)
Get csv file with sequences according to given criteria:
* You can choose from 21 different methods for calculating isoelectric point
Summary statistics related to proteome-wise predictions


Protein with the lowest isoelectric point:
>tr|A0A437LW05|A0A437LW05_9PROT Tyr recombinase domain-containing protein OS=Rhodovarius sp. CCP-6 OX=1979269 GN=EOD42_25040 PE=4 SV=1
MM1 pKa = 7.4AVEE4 pKa = 4.81LSDD7 pKa = 4.96GGYY10 pKa = 8.31DD11 pKa = 3.88TAWVSANGWTMSYY24 pKa = 10.46GVEE27 pKa = 3.88AGRR30 pKa = 11.84LIGTATEE37 pKa = 4.21LTGNALDD44 pKa = 3.95NVLVANADD52 pKa = 3.68FASAIHH58 pKa = 6.4GGGGNDD64 pKa = 4.52EE65 pKa = 4.13IWGSNQNGDD74 pKa = 4.05VLDD77 pKa = 4.68GGAGDD82 pKa = 3.83DD83 pKa = 3.81VLRR86 pKa = 11.84GGSGVTTFIGGEE98 pKa = 4.13GNDD101 pKa = 3.12QFVVNNVNSVIVEE114 pKa = 4.11KK115 pKa = 10.74AGEE118 pKa = 4.65GIDD121 pKa = 4.01TAWVSADD128 pKa = 2.78GWHH131 pKa = 6.41VSDD134 pKa = 3.46NVEE137 pKa = 3.84IVRR140 pKa = 11.84LFGAAHH146 pKa = 5.69SVVLGTSGAQVVANASGSTITAQAGDD172 pKa = 3.73NVFWGQGGNDD182 pKa = 3.57VFIGGAGNDD191 pKa = 3.1IFYY194 pKa = 10.51SGTGVTQMFGGAGNDD209 pKa = 3.23HH210 pKa = 7.2FIIKK214 pKa = 9.84NAADD218 pKa = 3.56TVVEE222 pKa = 4.22NANGGYY228 pKa = 7.93DD229 pKa = 3.81TAWLEE234 pKa = 4.04VSGWTVAEE242 pKa = 4.13NVEE245 pKa = 4.15VAYY248 pKa = 10.89LSGTANSITGNASGTNLVANSTMASALTAGTGFTIFWGSNYY289 pKa = 9.76GDD291 pKa = 3.56TMKK294 pKa = 10.49IGAGGGNVYY303 pKa = 10.49GYY305 pKa = 11.01GGADD309 pKa = 2.95TFEE312 pKa = 5.35FGPHH316 pKa = 5.76WGLTQVADD324 pKa = 4.52FNHH327 pKa = 6.94AEE329 pKa = 4.04GDD331 pKa = 3.71KK332 pKa = 11.2LDD334 pKa = 4.76FSASGLSMADD344 pKa = 3.38LNVTNYY350 pKa = 10.32SDD352 pKa = 3.33KK353 pKa = 11.13TLIEE357 pKa = 4.47HH358 pKa = 6.54NGEE361 pKa = 3.95QIILYY366 pKa = 10.05GVTSLQASDD375 pKa = 4.45FVFF378 pKa = 4.18
MM1 pKa = 7.4AVEE4 pKa = 4.81LSDD7 pKa = 4.96GGYY10 pKa = 8.31DD11 pKa = 3.88TAWVSANGWTMSYY24 pKa = 10.46GVEE27 pKa = 3.88AGRR30 pKa = 11.84LIGTATEE37 pKa = 4.21LTGNALDD44 pKa = 3.95NVLVANADD52 pKa = 3.68FASAIHH58 pKa = 6.4GGGGNDD64 pKa = 4.52EE65 pKa = 4.13IWGSNQNGDD74 pKa = 4.05VLDD77 pKa = 4.68GGAGDD82 pKa = 3.83DD83 pKa = 3.81VLRR86 pKa = 11.84GGSGVTTFIGGEE98 pKa = 4.13GNDD101 pKa = 3.12QFVVNNVNSVIVEE114 pKa = 4.11KK115 pKa = 10.74AGEE118 pKa = 4.65GIDD121 pKa = 4.01TAWVSADD128 pKa = 2.78GWHH131 pKa = 6.41VSDD134 pKa = 3.46NVEE137 pKa = 3.84IVRR140 pKa = 11.84LFGAAHH146 pKa = 5.69SVVLGTSGAQVVANASGSTITAQAGDD172 pKa = 3.73NVFWGQGGNDD182 pKa = 3.57VFIGGAGNDD191 pKa = 3.1IFYY194 pKa = 10.51SGTGVTQMFGGAGNDD209 pKa = 3.23HH210 pKa = 7.2FIIKK214 pKa = 9.84NAADD218 pKa = 3.56TVVEE222 pKa = 4.22NANGGYY228 pKa = 7.93DD229 pKa = 3.81TAWLEE234 pKa = 4.04VSGWTVAEE242 pKa = 4.13NVEE245 pKa = 4.15VAYY248 pKa = 10.89LSGTANSITGNASGTNLVANSTMASALTAGTGFTIFWGSNYY289 pKa = 9.76GDD291 pKa = 3.56TMKK294 pKa = 10.49IGAGGGNVYY303 pKa = 10.49GYY305 pKa = 11.01GGADD309 pKa = 2.95TFEE312 pKa = 5.35FGPHH316 pKa = 5.76WGLTQVADD324 pKa = 4.52FNHH327 pKa = 6.94AEE329 pKa = 4.04GDD331 pKa = 3.71KK332 pKa = 11.2LDD334 pKa = 4.76FSASGLSMADD344 pKa = 3.38LNVTNYY350 pKa = 10.32SDD352 pKa = 3.33KK353 pKa = 11.13TLIEE357 pKa = 4.47HH358 pKa = 6.54NGEE361 pKa = 3.95QIILYY366 pKa = 10.05GVTSLQASDD375 pKa = 4.45FVFF378 pKa = 4.18
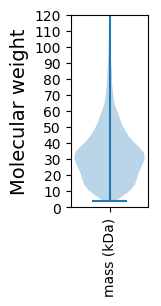
Molecular weight: 38.62 kDa
Isoelectric point according different methods:
Protein with the highest isoelectric point:
>tr|A0A437MF02|A0A437MF02_9PROT Uncharacterized protein OS=Rhodovarius sp. CCP-6 OX=1979269 GN=EOD42_14065 PE=4 SV=1
MM1 pKa = 7.35KK2 pKa = 9.43RR3 pKa = 11.84TYY5 pKa = 10.09QPSKK9 pKa = 8.8IVRR12 pKa = 11.84KK13 pKa = 9.24RR14 pKa = 11.84RR15 pKa = 11.84HH16 pKa = 4.55GFRR19 pKa = 11.84ARR21 pKa = 11.84MATVGGRR28 pKa = 11.84NVLAARR34 pKa = 11.84RR35 pKa = 11.84SKK37 pKa = 10.85GRR39 pKa = 11.84SKK41 pKa = 11.16LSAA44 pKa = 3.74
MM1 pKa = 7.35KK2 pKa = 9.43RR3 pKa = 11.84TYY5 pKa = 10.09QPSKK9 pKa = 8.8IVRR12 pKa = 11.84KK13 pKa = 9.24RR14 pKa = 11.84RR15 pKa = 11.84HH16 pKa = 4.55GFRR19 pKa = 11.84ARR21 pKa = 11.84MATVGGRR28 pKa = 11.84NVLAARR34 pKa = 11.84RR35 pKa = 11.84SKK37 pKa = 10.85GRR39 pKa = 11.84SKK41 pKa = 11.16LSAA44 pKa = 3.74
Molecular weight: 5.04 kDa
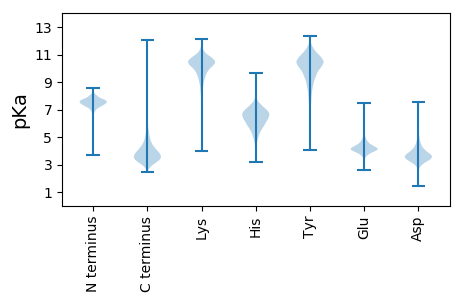
Isoelectric point according different methods:
Peptides (in silico digests for buttom-up proteomics)
Below you can find in silico digests of the whole proteome with Trypsin, Chymotrypsin, Trypsin+LysC, LysN, ArgC proteases suitable for different mass spec machines.| Try ESI |
 |
|---|
| ChTry ESI |
 |
|---|
| ArgC ESI |
 |
|---|
| LysN ESI |
 |
|---|
| TryLysC ESI |
 |
|---|
| Try MALDI |
 |
|---|
| ChTry MALDI |
 |
|---|
| ArgC MALDI |
 |
|---|
| LysN MALDI |
 |
|---|
| TryLysC MALDI |
 |
|---|
| Try LTQ |
 |
|---|
| ChTry LTQ |
 |
|---|
| ArgC LTQ |
 |
|---|
| LysN LTQ |
 |
|---|
| TryLysC LTQ |
 |
|---|
| Try MSlow |
 |
|---|
| ChTry MSlow |
 |
|---|
| ArgC MSlow |
 |
|---|
| LysN MSlow |
 |
|---|
| TryLysC MSlow |
 |
|---|
| Try MShigh |
 |
|---|
| ChTry MShigh |
 |
|---|
| ArgC MShigh |
 |
|---|
| LysN MShigh |
 |
|---|
| TryLysC MShigh |
 |
|---|
General Statistics
Number of major isoforms |
Number of additional isoforms |
Number of all proteins |
Number of amino acids |
Min. Seq. Length |
Max. Seq. Length |
Avg. Seq. Length |
Avg. Mol. Weight |
|---|---|---|---|---|---|---|---|
0 |
1623387 |
33 |
3309 |
322.9 |
34.72 |
Amino acid frequency
Ala |
Cys |
Asp |
Glu |
Phe |
Gly |
His |
Ile |
Lys |
Leu |
|---|---|---|---|---|---|---|---|---|---|
14.091 ± 0.054 | 0.841 ± 0.011 |
4.952 ± 0.025 | 5.566 ± 0.03 |
3.358 ± 0.019 | 9.262 ± 0.038 |
2.064 ± 0.017 | 4.331 ± 0.022 |
2.187 ± 0.025 | 10.62 ± 0.046 |
Met |
Asn |
Gln |
Pro |
Arg |
Ser |
Thr |
Val |
Trp |
Tyr |
|---|---|---|---|---|---|---|---|---|---|
2.688 ± 0.018 | 2.352 ± 0.024 |
6.147 ± 0.031 | 3.22 ± 0.021 |
7.938 ± 0.04 | 4.733 ± 0.023 |
5.119 ± 0.029 | 7.176 ± 0.027 |
1.5 ± 0.014 | 1.854 ± 0.017 |
Most of the basic statistics you can see at this page can be downloaded from this CSV file
Proteome-pI is available under Creative Commons Attribution-NoDerivs license, for more details see here
| Reference: Kozlowski LP. Proteome-pI 2.0: Proteome Isoelectric Point Database Update. Nucleic Acids Res. 2021, doi: 10.1093/nar/gkab944 | Contact: Lukasz P. Kozlowski |
