Victivallis vadensis
Taxonomy: cellular organisms; Bacteria; PVC group; Lentisphaerae; Lentisphaeria; Victivallales; Victivallaceae; Victivallis
Average proteome isoelectric point is 6.76
Get precalculated fractions of proteins

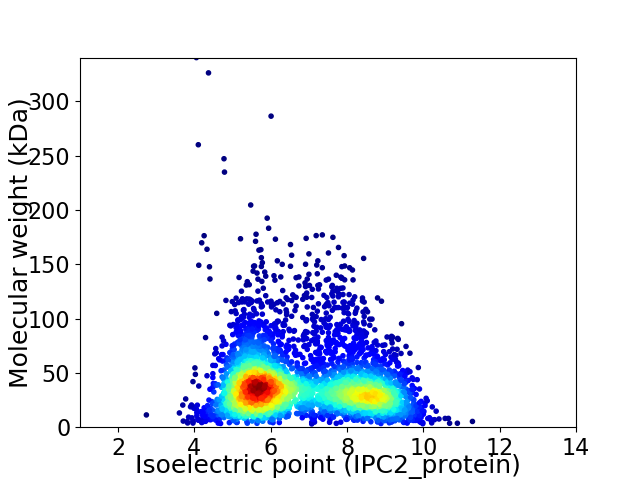
Virtual 2D-PAGE plot for 4059 proteins (isoelectric point calculated using IPC2_protein)
Get csv file with sequences according to given criteria:
* You can choose from 21 different methods for calculating isoelectric point
Summary statistics related to proteome-wise predictions


Protein with the lowest isoelectric point:
>tr|A0A2U1ANM2|A0A2U1ANM2_9BACT Prepilin-type N-terminal cleavage/methylation domain-containing protein/prepilin-type processing-associated H-X9-DG protein OS=Victivallis vadensis OX=172901 GN=C8D82_1297 PE=4 SV=1
MM1 pKa = 8.03DD2 pKa = 4.83EE3 pKa = 4.15SLKK6 pKa = 10.94FISFVVNYY14 pKa = 9.64CRR16 pKa = 11.84NTLIDD21 pKa = 4.18FYY23 pKa = 10.41PYY25 pKa = 10.05QQGHH29 pKa = 5.85EE30 pKa = 4.37KK31 pKa = 10.68LNEE34 pKa = 4.63DD35 pKa = 3.77IYY37 pKa = 11.06GMKK40 pKa = 10.2YY41 pKa = 10.17YY42 pKa = 10.73SEE44 pKa = 3.93DD45 pKa = 3.88HH46 pKa = 6.3EE47 pKa = 4.5WVEE50 pKa = 4.45IVGDD54 pKa = 3.84EE55 pKa = 4.12ATVGISEE62 pKa = 4.45YY63 pKa = 11.13AVDD66 pKa = 4.01EE67 pKa = 5.07LGDD70 pKa = 3.4ITYY73 pKa = 10.29VEE75 pKa = 4.5LPEE78 pKa = 4.87EE79 pKa = 4.34EE80 pKa = 4.87DD81 pKa = 4.0DD82 pKa = 5.61FIIGDD87 pKa = 3.58RR88 pKa = 11.84LGEE91 pKa = 4.17VEE93 pKa = 4.64SVNSSSEE100 pKa = 3.79IYY102 pKa = 10.58SPISGTVSQVNEE114 pKa = 4.11ALADD118 pKa = 3.8EE119 pKa = 5.19PGLINEE125 pKa = 4.36SPEE128 pKa = 4.12DD129 pKa = 3.78KK130 pKa = 10.89GWLCRR135 pKa = 11.84LTNFDD140 pKa = 4.44SSEE143 pKa = 4.35LDD145 pKa = 3.53DD146 pKa = 4.92MMNEE150 pKa = 4.21DD151 pKa = 5.1AYY153 pKa = 11.26QKK155 pKa = 10.35YY156 pKa = 9.82LRR158 pKa = 11.84KK159 pKa = 9.67LRR161 pKa = 11.84RR162 pKa = 3.33
MM1 pKa = 8.03DD2 pKa = 4.83EE3 pKa = 4.15SLKK6 pKa = 10.94FISFVVNYY14 pKa = 9.64CRR16 pKa = 11.84NTLIDD21 pKa = 4.18FYY23 pKa = 10.41PYY25 pKa = 10.05QQGHH29 pKa = 5.85EE30 pKa = 4.37KK31 pKa = 10.68LNEE34 pKa = 4.63DD35 pKa = 3.77IYY37 pKa = 11.06GMKK40 pKa = 10.2YY41 pKa = 10.17YY42 pKa = 10.73SEE44 pKa = 3.93DD45 pKa = 3.88HH46 pKa = 6.3EE47 pKa = 4.5WVEE50 pKa = 4.45IVGDD54 pKa = 3.84EE55 pKa = 4.12ATVGISEE62 pKa = 4.45YY63 pKa = 11.13AVDD66 pKa = 4.01EE67 pKa = 5.07LGDD70 pKa = 3.4ITYY73 pKa = 10.29VEE75 pKa = 4.5LPEE78 pKa = 4.87EE79 pKa = 4.34EE80 pKa = 4.87DD81 pKa = 4.0DD82 pKa = 5.61FIIGDD87 pKa = 3.58RR88 pKa = 11.84LGEE91 pKa = 4.17VEE93 pKa = 4.64SVNSSSEE100 pKa = 3.79IYY102 pKa = 10.58SPISGTVSQVNEE114 pKa = 4.11ALADD118 pKa = 3.8EE119 pKa = 5.19PGLINEE125 pKa = 4.36SPEE128 pKa = 4.12DD129 pKa = 3.78KK130 pKa = 10.89GWLCRR135 pKa = 11.84LTNFDD140 pKa = 4.44SSEE143 pKa = 4.35LDD145 pKa = 3.53DD146 pKa = 4.92MMNEE150 pKa = 4.21DD151 pKa = 5.1AYY153 pKa = 11.26QKK155 pKa = 10.35YY156 pKa = 9.82LRR158 pKa = 11.84KK159 pKa = 9.67LRR161 pKa = 11.84RR162 pKa = 3.33
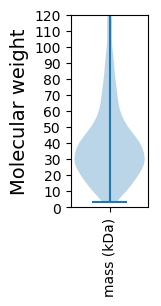
Molecular weight: 18.68 kDa
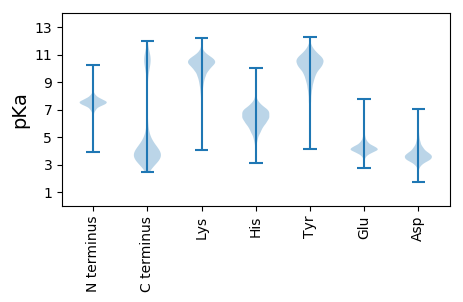
Isoelectric point according different methods:
Protein with the highest isoelectric point:
>tr|A0A2U1AE99|A0A2U1AE99_9BACT AlpA family transcriptional regulator OS=Victivallis vadensis OX=172901 GN=C8D82_1485 PE=4 SV=1
MM1 pKa = 7.45KK2 pKa = 9.61RR3 pKa = 11.84TFQPSNRR10 pKa = 11.84RR11 pKa = 11.84RR12 pKa = 11.84KK13 pKa = 9.41RR14 pKa = 11.84RR15 pKa = 11.84IGFFARR21 pKa = 11.84MATKK25 pKa = 10.45AGRR28 pKa = 11.84LVIKK32 pKa = 10.44RR33 pKa = 11.84RR34 pKa = 11.84RR35 pKa = 11.84QKK37 pKa = 10.71GRR39 pKa = 11.84AKK41 pKa = 9.64LTAA44 pKa = 4.21
MM1 pKa = 7.45KK2 pKa = 9.61RR3 pKa = 11.84TFQPSNRR10 pKa = 11.84RR11 pKa = 11.84RR12 pKa = 11.84KK13 pKa = 9.41RR14 pKa = 11.84RR15 pKa = 11.84IGFFARR21 pKa = 11.84MATKK25 pKa = 10.45AGRR28 pKa = 11.84LVIKK32 pKa = 10.44RR33 pKa = 11.84RR34 pKa = 11.84RR35 pKa = 11.84QKK37 pKa = 10.71GRR39 pKa = 11.84AKK41 pKa = 9.64LTAA44 pKa = 4.21
Molecular weight: 5.3 kDa
Isoelectric point according different methods:
Peptides (in silico digests for buttom-up proteomics)
Below you can find in silico digests of the whole proteome with Trypsin, Chymotrypsin, Trypsin+LysC, LysN, ArgC proteases suitable for different mass spec machines.| Try ESI |
 |
|---|
| ChTry ESI |
 |
|---|
| ArgC ESI |
 |
|---|
| LysN ESI |
 |
|---|
| TryLysC ESI |
 |
|---|
| Try MALDI |
 |
|---|
| ChTry MALDI |
 |
|---|
| ArgC MALDI |
 |
|---|
| LysN MALDI |
 |
|---|
| TryLysC MALDI |
 |
|---|
| Try LTQ |
 |
|---|
| ChTry LTQ |
 |
|---|
| ArgC LTQ |
 |
|---|
| LysN LTQ |
 |
|---|
| TryLysC LTQ |
 |
|---|
| Try MSlow |
 |
|---|
| ChTry MSlow |
 |
|---|
| ArgC MSlow |
 |
|---|
| LysN MSlow |
 |
|---|
| TryLysC MSlow |
 |
|---|
| Try MShigh |
 |
|---|
| ChTry MShigh |
 |
|---|
| ArgC MShigh |
 |
|---|
| LysN MShigh |
 |
|---|
| TryLysC MShigh |
 |
|---|
General Statistics
Number of major isoforms |
Number of additional isoforms |
Number of all proteins |
Number of amino acids |
Min. Seq. Length |
Max. Seq. Length |
Avg. Seq. Length |
Avg. Mol. Weight |
|---|---|---|---|---|---|---|---|
0 |
1560380 |
29 |
3328 |
384.4 |
42.67 |
Amino acid frequency
Ala |
Cys |
Asp |
Glu |
Phe |
Gly |
His |
Ile |
Lys |
Leu |
|---|---|---|---|---|---|---|---|---|---|
10.075 ± 0.04 | 1.484 ± 0.016 |
5.135 ± 0.025 | 6.64 ± 0.035 |
4.576 ± 0.025 | 8.07 ± 0.042 |
1.833 ± 0.015 | 5.058 ± 0.029 |
4.32 ± 0.032 | 10.136 ± 0.041 |
Met |
Asn |
Gln |
Pro |
Arg |
Ser |
Thr |
Val |
Trp |
Tyr |
|---|---|---|---|---|---|---|---|---|---|
2.251 ± 0.017 | 3.612 ± 0.029 |
5.264 ± 0.033 | 2.871 ± 0.021 |
7.253 ± 0.044 | 5.426 ± 0.027 |
4.802 ± 0.027 | 6.529 ± 0.033 |
1.491 ± 0.016 | 3.174 ± 0.02 |
Most of the basic statistics you can see at this page can be downloaded from this CSV file
Proteome-pI is available under Creative Commons Attribution-NoDerivs license, for more details see here
| Reference: Kozlowski LP. Proteome-pI 2.0: Proteome Isoelectric Point Database Update. Nucleic Acids Res. 2021, doi: 10.1093/nar/gkab944 | Contact: Lukasz P. Kozlowski |
