Musa acuminata subsp. malaccensis (Wild banana) (Musa malaccensis)
Taxonomy: cellular organisms; Eukaryota; Viridiplantae; Streptophyta; Streptophytina; Embryophyta; Tracheophyta; Euphyllophyta; Spermatophyta; Magnoliopsida; Mesangiospermae; Liliopsida; Petrosaviidae; commelinids; Zingiberales; Musaceae; Musa; Musa acuminata
Average proteome isoelectric point is 6.95
Get precalculated fractions of proteins

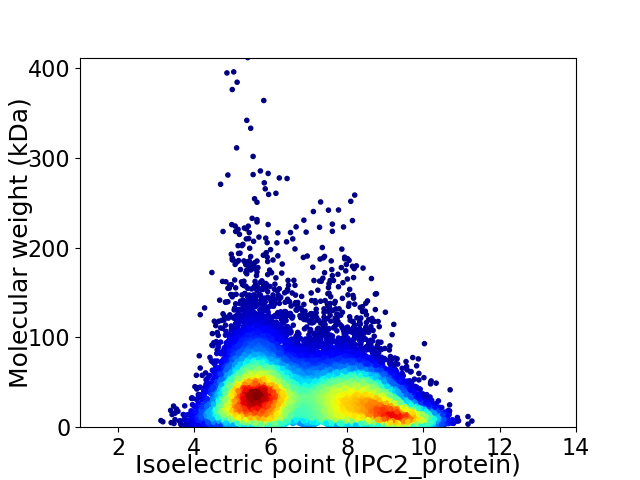
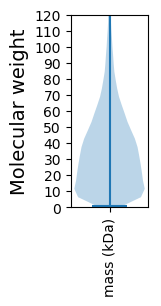
Virtual 2D-PAGE plot for 36474 proteins (isoelectric point calculated using IPC2_protein)
Get csv file with sequences according to given criteria:
* You can choose from 21 different methods for calculating isoelectric point
Summary statistics related to proteome-wise predictions


Protein with the lowest isoelectric point:
>tr|M0U7Q2|M0U7Q2_MUSAM Uncharacterized protein OS=Musa acuminata subsp. malaccensis OX=214687 GN=103973565 PE=4 SV=1
MM1 pKa = 7.94ASLLLLLSMASLLLSPLSLADD22 pKa = 3.99PNATTMPTPSGEE34 pKa = 4.22IQRR37 pKa = 11.84EE38 pKa = 3.58MDD40 pKa = 3.41QQILATVLPDD50 pKa = 3.53SSSNTQPFLTSPTGKK65 pKa = 8.31YY66 pKa = 7.94TSYY69 pKa = 11.41LLRR72 pKa = 11.84HH73 pKa = 5.52KK74 pKa = 7.21TTPEE78 pKa = 3.6SGGYY82 pKa = 10.48GSDD85 pKa = 3.04FCYY88 pKa = 10.39IQIQDD93 pKa = 3.96TVSGDD98 pKa = 4.05SVWEE102 pKa = 4.32SEE104 pKa = 4.39CEE106 pKa = 4.06PVSSANACTLVFSDD120 pKa = 3.72TGLAVLDD127 pKa = 4.81GSQSVWDD134 pKa = 4.0TGASNGNNFPATLEE148 pKa = 4.03LADD151 pKa = 5.06LGDD154 pKa = 3.79MMVADD159 pKa = 4.89KK160 pKa = 11.14DD161 pKa = 4.21GEE163 pKa = 4.63LVWKK167 pKa = 10.64ASDD170 pKa = 3.93DD171 pKa = 3.46PRR173 pKa = 11.84VNQGCGSPDD182 pKa = 3.6LGSGSPTFVGGDD194 pKa = 3.46DD195 pKa = 4.22SSPLGQQLPPPPPSLSEE212 pKa = 3.99GALPLAPASPPVVGDD227 pKa = 4.23DD228 pKa = 3.93NLTSGQAPLLAPTSAPFAAPTSGDD252 pKa = 3.17EE253 pKa = 4.25NIPYY257 pKa = 9.18NQQPPSYY264 pKa = 9.15SSNVAFGQQQEE275 pKa = 4.18QQMSAFHH282 pKa = 6.53GLHH285 pKa = 6.13GVNQPLVDD293 pKa = 3.73NNAYY297 pKa = 10.49DD298 pKa = 3.66SGCSRR303 pKa = 11.84KK304 pKa = 9.79EE305 pKa = 3.65GLIGILLVVVSHH317 pKa = 6.5LVLRR321 pKa = 11.84GLL323 pKa = 4.07
MM1 pKa = 7.94ASLLLLLSMASLLLSPLSLADD22 pKa = 3.99PNATTMPTPSGEE34 pKa = 4.22IQRR37 pKa = 11.84EE38 pKa = 3.58MDD40 pKa = 3.41QQILATVLPDD50 pKa = 3.53SSSNTQPFLTSPTGKK65 pKa = 8.31YY66 pKa = 7.94TSYY69 pKa = 11.41LLRR72 pKa = 11.84HH73 pKa = 5.52KK74 pKa = 7.21TTPEE78 pKa = 3.6SGGYY82 pKa = 10.48GSDD85 pKa = 3.04FCYY88 pKa = 10.39IQIQDD93 pKa = 3.96TVSGDD98 pKa = 4.05SVWEE102 pKa = 4.32SEE104 pKa = 4.39CEE106 pKa = 4.06PVSSANACTLVFSDD120 pKa = 3.72TGLAVLDD127 pKa = 4.81GSQSVWDD134 pKa = 4.0TGASNGNNFPATLEE148 pKa = 4.03LADD151 pKa = 5.06LGDD154 pKa = 3.79MMVADD159 pKa = 4.89KK160 pKa = 11.14DD161 pKa = 4.21GEE163 pKa = 4.63LVWKK167 pKa = 10.64ASDD170 pKa = 3.93DD171 pKa = 3.46PRR173 pKa = 11.84VNQGCGSPDD182 pKa = 3.6LGSGSPTFVGGDD194 pKa = 3.46DD195 pKa = 4.22SSPLGQQLPPPPPSLSEE212 pKa = 3.99GALPLAPASPPVVGDD227 pKa = 4.23DD228 pKa = 3.93NLTSGQAPLLAPTSAPFAAPTSGDD252 pKa = 3.17EE253 pKa = 4.25NIPYY257 pKa = 9.18NQQPPSYY264 pKa = 9.15SSNVAFGQQQEE275 pKa = 4.18QQMSAFHH282 pKa = 6.53GLHH285 pKa = 6.13GVNQPLVDD293 pKa = 3.73NNAYY297 pKa = 10.49DD298 pKa = 3.66SGCSRR303 pKa = 11.84KK304 pKa = 9.79EE305 pKa = 3.65GLIGILLVVVSHH317 pKa = 6.5LVLRR321 pKa = 11.84GLL323 pKa = 4.07
Molecular weight: 33.64 kDa
Isoelectric point according different methods:
Protein with the highest isoelectric point:
>tr|M0UB60|M0UB60_MUSAM IPPc domain-containing protein OS=Musa acuminata subsp. malaccensis OX=214687 PE=3 SV=1
MM1 pKa = 7.91VMASTSAAQQVLRR14 pKa = 11.84GGSLSSPPPPRR25 pKa = 11.84RR26 pKa = 11.84SPGSRR31 pKa = 11.84RR32 pKa = 11.84SRR34 pKa = 11.84AVATSSTRR42 pKa = 11.84NGLMARR48 pKa = 11.84SRR50 pKa = 11.84VTTGSTRR57 pKa = 11.84LASARR62 pKa = 11.84TRR64 pKa = 11.84PSS66 pKa = 2.71
MM1 pKa = 7.91VMASTSAAQQVLRR14 pKa = 11.84GGSLSSPPPPRR25 pKa = 11.84RR26 pKa = 11.84SPGSRR31 pKa = 11.84RR32 pKa = 11.84SRR34 pKa = 11.84AVATSSTRR42 pKa = 11.84NGLMARR48 pKa = 11.84SRR50 pKa = 11.84VTTGSTRR57 pKa = 11.84LASARR62 pKa = 11.84TRR64 pKa = 11.84PSS66 pKa = 2.71
Molecular weight: 6.87 kDa
Isoelectric point according different methods:
Peptides (in silico digests for buttom-up proteomics)
Below you can find in silico digests of the whole proteome with Trypsin, Chymotrypsin, Trypsin+LysC, LysN, ArgC proteases suitable for different mass spec machines.| Try ESI |
 |
|---|
| ChTry ESI |
 |
|---|
| ArgC ESI |
 |
|---|
| LysN ESI |
 |
|---|
| TryLysC ESI |
 |
|---|
| Try MALDI |
 |
|---|
| ChTry MALDI |
 |
|---|
| ArgC MALDI |
 |
|---|
| LysN MALDI |
 |
|---|
| TryLysC MALDI |
 |
|---|
| Try LTQ |
 |
|---|
| ChTry LTQ |
 |
|---|
| ArgC LTQ |
 |
|---|
| LysN LTQ |
 |
|---|
| TryLysC LTQ |
 |
|---|
| Try MSlow |
 |
|---|
| ChTry MSlow |
 |
|---|
| ArgC MSlow |
 |
|---|
| LysN MSlow |
 |
|---|
| TryLysC MSlow |
 |
|---|
| Try MShigh |
 |
|---|
| ChTry MShigh |
 |
|---|
| ArgC MShigh |
 |
|---|
| LysN MShigh |
 |
|---|
| TryLysC MShigh |
 |
|---|
General Statistics
Number of major isoforms |
Number of additional isoforms |
Number of all proteins |
Number of amino acids |
Min. Seq. Length |
Max. Seq. Length |
Avg. Seq. Length |
Avg. Mol. Weight |
|---|---|---|---|---|---|---|---|
0 |
12599352 |
10 |
12011 |
345.4 |
38.23 |
Amino acid frequency
Ala |
Cys |
Asp |
Glu |
Phe |
Gly |
His |
Ile |
Lys |
Leu |
|---|---|---|---|---|---|---|---|---|---|
7.616 ± 0.017 | 1.987 ± 0.007 |
5.209 ± 0.009 | 6.14 ± 0.015 |
4.058 ± 0.01 | 6.741 ± 0.014 |
2.511 ± 0.007 | 4.968 ± 0.011 |
5.345 ± 0.015 | 9.876 ± 0.022 |
Met |
Asn |
Gln |
Pro |
Arg |
Ser |
Thr |
Val |
Trp |
Tyr |
|---|---|---|---|---|---|---|---|---|---|
2.45 ± 0.006 | 3.789 ± 0.01 |
5.149 ± 0.013 | 3.534 ± 0.011 |
5.984 ± 0.013 | 8.902 ± 0.02 |
4.757 ± 0.009 | 6.509 ± 0.011 |
1.326 ± 0.005 | 2.711 ± 0.008 |
Most of the basic statistics you can see at this page can be downloaded from this CSV file
Proteome-pI is available under Creative Commons Attribution-NoDerivs license, for more details see here
| Reference: Kozlowski LP. Proteome-pI 2.0: Proteome Isoelectric Point Database Update. Nucleic Acids Res. 2021, doi: 10.1093/nar/gkab944 | Contact: Lukasz P. Kozlowski |
