butyrate-producing bacterium SS3/4
Taxonomy: cellular organisms; Bacteria; Terrabacteria group; Firmicutes; Clostridia; Eubacteriales; unclassified Eubacteriales
Average proteome isoelectric point is 6.16
Get precalculated fractions of proteins

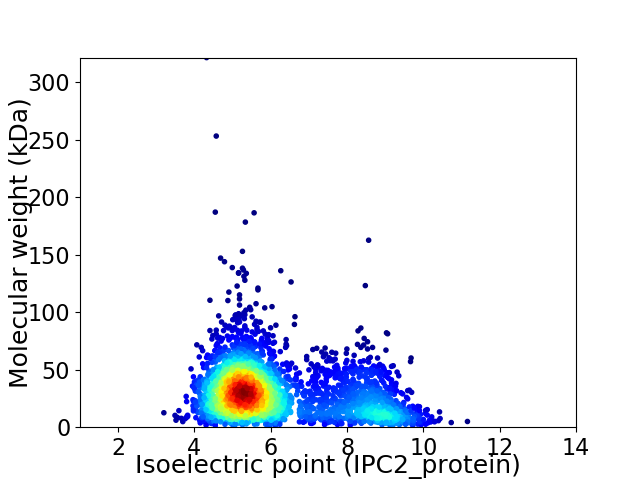
Virtual 2D-PAGE plot for 2993 proteins (isoelectric point calculated using IPC2_protein)
Get csv file with sequences according to given criteria:
* You can choose from 21 different methods for calculating isoelectric point
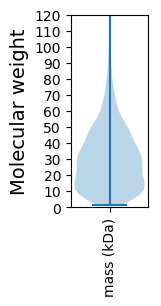
Summary statistics related to proteome-wise predictions


Protein with the lowest isoelectric point:
>tr|D7GP80|D7GP80_9FIRM Bifunctional NAD(P)H-hydrate repair enzyme OS=butyrate-producing bacterium SS3/4 OX=245014 GN=nnrE PE=3 SV=1
MM1 pKa = 7.42KK2 pKa = 10.31KK3 pKa = 8.63VTALAMAAVVAASALTGCGSSSTAEE28 pKa = 3.82TTAAATEE35 pKa = 4.24AKK37 pKa = 9.54TEE39 pKa = 3.81AAAADD44 pKa = 3.59STKK47 pKa = 10.63AAKK50 pKa = 10.07EE51 pKa = 3.75DD52 pKa = 3.29GKK54 pKa = 9.49TYY56 pKa = 11.03NVGICQLVQHH66 pKa = 7.09PALDD70 pKa = 3.65AATEE74 pKa = 4.18GFEE77 pKa = 5.09AALKK81 pKa = 10.79DD82 pKa = 3.75KK83 pKa = 11.37LGDD86 pKa = 3.55NVKK89 pKa = 10.35FDD91 pKa = 4.16LQNASGDD98 pKa = 3.91SATCATIINQFVSNDD113 pKa = 2.89VDD115 pKa = 5.54LILANATAALQAAAAGTSEE134 pKa = 4.05IPILGTSITDD144 pKa = 3.22YY145 pKa = 10.35ATALDD150 pKa = 3.6IDD152 pKa = 4.02NWTGTTGLNISGTSDD167 pKa = 4.45LAPLDD172 pKa = 3.6QQAAMLNEE180 pKa = 4.74LFPDD184 pKa = 4.04AKK186 pKa = 10.85NVGLLYY192 pKa = 10.79CSAEE196 pKa = 4.16PNSKK200 pKa = 10.05YY201 pKa = 10.18QATTVKK207 pKa = 10.65GYY209 pKa = 10.75LEE211 pKa = 4.04EE212 pKa = 5.78LGYY215 pKa = 8.66TCKK218 pKa = 10.46EE219 pKa = 3.77YY220 pKa = 10.54TFADD224 pKa = 3.85SNDD227 pKa = 3.42IASVTTTAAGEE238 pKa = 4.01NDD240 pKa = 3.82VLYY243 pKa = 11.18VPTDD247 pKa = 3.2NTAASNAEE255 pKa = 4.28IINNICLPAKK265 pKa = 10.07VPVIAGEE272 pKa = 3.92EE273 pKa = 5.06GICSGCGVATLSIDD287 pKa = 3.79YY288 pKa = 11.02YY289 pKa = 11.19DD290 pKa = 3.63IGYY293 pKa = 9.54KK294 pKa = 9.96AGEE297 pKa = 4.16MGAEE301 pKa = 3.68ILMDD305 pKa = 3.96GKK307 pKa = 10.15DD308 pKa = 3.7VKK310 pKa = 10.86EE311 pKa = 4.09MPIEE315 pKa = 4.18FAPEE319 pKa = 3.66VTKK322 pKa = 10.53KK323 pKa = 10.59YY324 pKa = 11.18NKK326 pKa = 9.95ANCEE330 pKa = 3.91ALGITVPDD338 pKa = 4.17DD339 pKa = 3.36YY340 pKa = 11.89VAIEE344 pKa = 4.0EE345 pKa = 4.29
MM1 pKa = 7.42KK2 pKa = 10.31KK3 pKa = 8.63VTALAMAAVVAASALTGCGSSSTAEE28 pKa = 3.82TTAAATEE35 pKa = 4.24AKK37 pKa = 9.54TEE39 pKa = 3.81AAAADD44 pKa = 3.59STKK47 pKa = 10.63AAKK50 pKa = 10.07EE51 pKa = 3.75DD52 pKa = 3.29GKK54 pKa = 9.49TYY56 pKa = 11.03NVGICQLVQHH66 pKa = 7.09PALDD70 pKa = 3.65AATEE74 pKa = 4.18GFEE77 pKa = 5.09AALKK81 pKa = 10.79DD82 pKa = 3.75KK83 pKa = 11.37LGDD86 pKa = 3.55NVKK89 pKa = 10.35FDD91 pKa = 4.16LQNASGDD98 pKa = 3.91SATCATIINQFVSNDD113 pKa = 2.89VDD115 pKa = 5.54LILANATAALQAAAAGTSEE134 pKa = 4.05IPILGTSITDD144 pKa = 3.22YY145 pKa = 10.35ATALDD150 pKa = 3.6IDD152 pKa = 4.02NWTGTTGLNISGTSDD167 pKa = 4.45LAPLDD172 pKa = 3.6QQAAMLNEE180 pKa = 4.74LFPDD184 pKa = 4.04AKK186 pKa = 10.85NVGLLYY192 pKa = 10.79CSAEE196 pKa = 4.16PNSKK200 pKa = 10.05YY201 pKa = 10.18QATTVKK207 pKa = 10.65GYY209 pKa = 10.75LEE211 pKa = 4.04EE212 pKa = 5.78LGYY215 pKa = 8.66TCKK218 pKa = 10.46EE219 pKa = 3.77YY220 pKa = 10.54TFADD224 pKa = 3.85SNDD227 pKa = 3.42IASVTTTAAGEE238 pKa = 4.01NDD240 pKa = 3.82VLYY243 pKa = 11.18VPTDD247 pKa = 3.2NTAASNAEE255 pKa = 4.28IINNICLPAKK265 pKa = 10.07VPVIAGEE272 pKa = 3.92EE273 pKa = 5.06GICSGCGVATLSIDD287 pKa = 3.79YY288 pKa = 11.02YY289 pKa = 11.19DD290 pKa = 3.63IGYY293 pKa = 9.54KK294 pKa = 9.96AGEE297 pKa = 4.16MGAEE301 pKa = 3.68ILMDD305 pKa = 3.96GKK307 pKa = 10.15DD308 pKa = 3.7VKK310 pKa = 10.86EE311 pKa = 4.09MPIEE315 pKa = 4.18FAPEE319 pKa = 3.66VTKK322 pKa = 10.53KK323 pKa = 10.59YY324 pKa = 11.18NKK326 pKa = 9.95ANCEE330 pKa = 3.91ALGITVPDD338 pKa = 4.17DD339 pKa = 3.36YY340 pKa = 11.89VAIEE344 pKa = 4.0EE345 pKa = 4.29
Molecular weight: 35.7 kDa
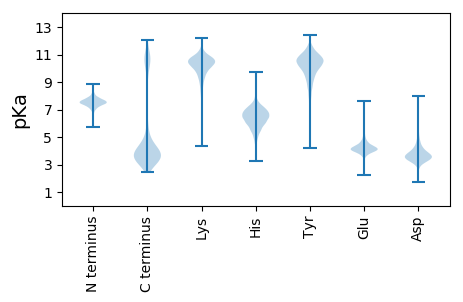
Isoelectric point according different methods:
Protein with the highest isoelectric point:
>tr|D7GRM5|D7GRM5_9FIRM Predicted RNA-binding protein OS=butyrate-producing bacterium SS3/4 OX=245014 GN=CK3_06570 PE=4 SV=1
MM1 pKa = 7.67KK2 pKa = 8.73MTFQPKK8 pKa = 7.29NTQRR12 pKa = 11.84KK13 pKa = 7.77RR14 pKa = 11.84VHH16 pKa = 6.19GFRR19 pKa = 11.84ARR21 pKa = 11.84MATAGGRR28 pKa = 11.84KK29 pKa = 8.88VLAARR34 pKa = 11.84RR35 pKa = 11.84AKK37 pKa = 10.29GRR39 pKa = 11.84ARR41 pKa = 11.84LSAA44 pKa = 3.91
MM1 pKa = 7.67KK2 pKa = 8.73MTFQPKK8 pKa = 7.29NTQRR12 pKa = 11.84KK13 pKa = 7.77RR14 pKa = 11.84VHH16 pKa = 6.19GFRR19 pKa = 11.84ARR21 pKa = 11.84MATAGGRR28 pKa = 11.84KK29 pKa = 8.88VLAARR34 pKa = 11.84RR35 pKa = 11.84AKK37 pKa = 10.29GRR39 pKa = 11.84ARR41 pKa = 11.84LSAA44 pKa = 3.91
Molecular weight: 4.97 kDa
Isoelectric point according different methods:
Peptides (in silico digests for buttom-up proteomics)
Below you can find in silico digests of the whole proteome with Trypsin, Chymotrypsin, Trypsin+LysC, LysN, ArgC proteases suitable for different mass spec machines.| Try ESI |
 |
|---|
| ChTry ESI |
 |
|---|
| ArgC ESI |
 |
|---|
| LysN ESI |
 |
|---|
| TryLysC ESI |
 |
|---|
| Try MALDI |
 |
|---|
| ChTry MALDI |
 |
|---|
| ArgC MALDI |
 |
|---|
| LysN MALDI |
 |
|---|
| TryLysC MALDI |
 |
|---|
| Try LTQ |
 |
|---|
| ChTry LTQ |
 |
|---|
| ArgC LTQ |
 |
|---|
| LysN LTQ |
 |
|---|
| TryLysC LTQ |
 |
|---|
| Try MSlow |
 |
|---|
| ChTry MSlow |
 |
|---|
| ArgC MSlow |
 |
|---|
| LysN MSlow |
 |
|---|
| TryLysC MSlow |
 |
|---|
| Try MShigh |
 |
|---|
| ChTry MShigh |
 |
|---|
| ArgC MShigh |
 |
|---|
| LysN MShigh |
 |
|---|
| TryLysC MShigh |
 |
|---|
General Statistics
Number of major isoforms |
Number of additional isoforms |
Number of all proteins |
Number of amino acids |
Min. Seq. Length |
Max. Seq. Length |
Avg. Seq. Length |
Avg. Mol. Weight |
|---|---|---|---|---|---|---|---|
0 |
854591 |
13 |
3132 |
285.5 |
31.83 |
Amino acid frequency
Ala |
Cys |
Asp |
Glu |
Phe |
Gly |
His |
Ile |
Lys |
Leu |
|---|---|---|---|---|---|---|---|---|---|
8.172 ± 0.05 | 1.463 ± 0.019 |
5.662 ± 0.044 | 7.551 ± 0.055 |
4.059 ± 0.036 | 7.572 ± 0.059 |
1.755 ± 0.018 | 6.871 ± 0.042 |
6.75 ± 0.043 | 8.785 ± 0.06 |
Met |
Asn |
Gln |
Pro |
Arg |
Ser |
Thr |
Val |
Trp |
Tyr |
|---|---|---|---|---|---|---|---|---|---|
3.244 ± 0.025 | 4.108 ± 0.038 |
3.488 ± 0.026 | 2.946 ± 0.027 |
4.599 ± 0.042 | 5.675 ± 0.039 |
5.555 ± 0.038 | 6.959 ± 0.044 |
0.922 ± 0.015 | 3.865 ± 0.032 |
Most of the basic statistics you can see at this page can be downloaded from this CSV file
Proteome-pI is available under Creative Commons Attribution-NoDerivs license, for more details see here
| Reference: Kozlowski LP. Proteome-pI 2.0: Proteome Isoelectric Point Database Update. Nucleic Acids Res. 2021, doi: 10.1093/nar/gkab944 | Contact: Lukasz P. Kozlowski |
