Alkalilimnicola ehrlichii (strain ATCC BAA-1101 / DSM 17681 / MLHE-1)
Taxonomy: cellular organisms; Bacteria; Proteobacteria; Gammaproteobacteria; Chromatiales; Ectothiorhodospiraceae; Alkalilimnicola; Alkalilimnicola ehrlichii
Average proteome isoelectric point is 6.3
Get precalculated fractions of proteins

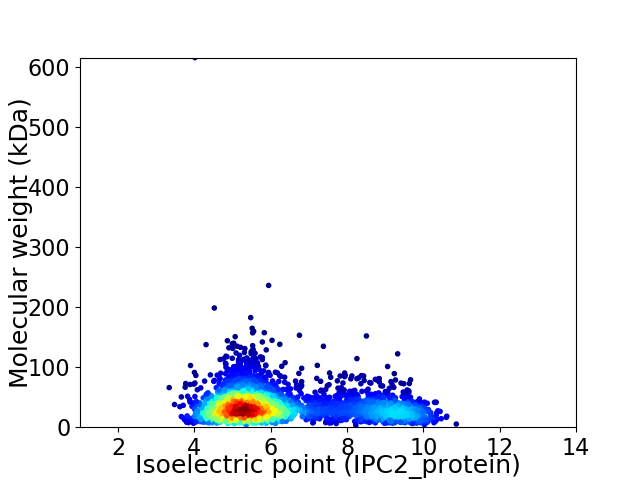
Virtual 2D-PAGE plot for 2862 proteins (isoelectric point calculated using IPC2_protein)
Get csv file with sequences according to given criteria:
* You can choose from 21 different methods for calculating isoelectric point
Summary statistics related to proteome-wise predictions


Protein with the lowest isoelectric point:
>tr|Q0AAP8|Q0AAP8_ALKEH Uncharacterized protein OS=Alkalilimnicola ehrlichii (strain ATCC BAA-1101 / DSM 17681 / MLHE-1) OX=187272 GN=Mlg_0735 PE=4 SV=1
MM1 pKa = 7.95KK2 pKa = 10.31FRR4 pKa = 11.84LLLALAALYY13 pKa = 7.22PASMTAVAQTDD24 pKa = 3.68TATFDD29 pKa = 3.18VTATVDD35 pKa = 3.5PTCTVDD41 pKa = 4.09ADD43 pKa = 3.67NLVFGTYY50 pKa = 10.49DD51 pKa = 3.62PFSDD55 pKa = 3.86TPLDD59 pKa = 3.79EE60 pKa = 4.44NSEE63 pKa = 3.84IRR65 pKa = 11.84VQCTSDD71 pKa = 2.97TPYY74 pKa = 11.06DD75 pKa = 3.39IGLDD79 pKa = 3.8DD80 pKa = 5.12GDD82 pKa = 3.69NTGAEE87 pKa = 4.61GEE89 pKa = 4.18RR90 pKa = 11.84RR91 pKa = 11.84MALADD96 pKa = 3.45EE97 pKa = 4.68SDD99 pKa = 3.46FLEE102 pKa = 4.25YY103 pKa = 10.81DD104 pKa = 4.15LYY106 pKa = 11.16HH107 pKa = 7.3DD108 pKa = 3.99NHH110 pKa = 6.98GGTSWGDD117 pKa = 2.93IDD119 pKa = 5.73SGAEE123 pKa = 3.82LTGLSGTGSEE133 pKa = 4.13QSYY136 pKa = 9.18VVYY139 pKa = 10.69GRR141 pKa = 11.84IFAEE145 pKa = 3.85QSVAVGNYY153 pKa = 8.58VDD155 pKa = 4.21TIEE158 pKa = 4.84VTVKK162 pKa = 8.76WW163 pKa = 3.67
MM1 pKa = 7.95KK2 pKa = 10.31FRR4 pKa = 11.84LLLALAALYY13 pKa = 7.22PASMTAVAQTDD24 pKa = 3.68TATFDD29 pKa = 3.18VTATVDD35 pKa = 3.5PTCTVDD41 pKa = 4.09ADD43 pKa = 3.67NLVFGTYY50 pKa = 10.49DD51 pKa = 3.62PFSDD55 pKa = 3.86TPLDD59 pKa = 3.79EE60 pKa = 4.44NSEE63 pKa = 3.84IRR65 pKa = 11.84VQCTSDD71 pKa = 2.97TPYY74 pKa = 11.06DD75 pKa = 3.39IGLDD79 pKa = 3.8DD80 pKa = 5.12GDD82 pKa = 3.69NTGAEE87 pKa = 4.61GEE89 pKa = 4.18RR90 pKa = 11.84RR91 pKa = 11.84MALADD96 pKa = 3.45EE97 pKa = 4.68SDD99 pKa = 3.46FLEE102 pKa = 4.25YY103 pKa = 10.81DD104 pKa = 4.15LYY106 pKa = 11.16HH107 pKa = 7.3DD108 pKa = 3.99NHH110 pKa = 6.98GGTSWGDD117 pKa = 2.93IDD119 pKa = 5.73SGAEE123 pKa = 3.82LTGLSGTGSEE133 pKa = 4.13QSYY136 pKa = 9.18VVYY139 pKa = 10.69GRR141 pKa = 11.84IFAEE145 pKa = 3.85QSVAVGNYY153 pKa = 8.58VDD155 pKa = 4.21TIEE158 pKa = 4.84VTVKK162 pKa = 8.76WW163 pKa = 3.67
Molecular weight: 17.62 kDa
Isoelectric point according different methods:
Protein with the highest isoelectric point:
>tr|Q0AA45|Q0AA45_ALKEH Cation diffusion facilitator family transporter OS=Alkalilimnicola ehrlichii (strain ATCC BAA-1101 / DSM 17681 / MLHE-1) OX=187272 GN=Mlg_0938 PE=4 SV=1
MM1 pKa = 6.96KK2 pKa = 9.5TAIPVNTQGRR12 pKa = 11.84VSGHH16 pKa = 5.49FAKK19 pKa = 10.57APYY22 pKa = 9.41MLVLTDD28 pKa = 3.38EE29 pKa = 4.95GQRR32 pKa = 11.84QWVANPMDD40 pKa = 4.82ADD42 pKa = 4.12RR43 pKa = 11.84CSGRR47 pKa = 11.84CKK49 pKa = 10.49LLAEE53 pKa = 4.69LEE55 pKa = 4.41QAGVTRR61 pKa = 11.84VLVRR65 pKa = 11.84QIGQRR70 pKa = 11.84TLGRR74 pKa = 11.84FLRR77 pKa = 11.84AGLQVYY83 pKa = 9.25RR84 pKa = 11.84LPAGATALPRR94 pKa = 11.84AAAIPAEE101 pKa = 4.2AQALSQASQGRR112 pKa = 11.84PSKK115 pKa = 10.37PRR117 pKa = 11.84ASHH120 pKa = 6.49GEE122 pKa = 4.02GTAGMTGCCGHH133 pKa = 6.85HH134 pKa = 6.35
MM1 pKa = 6.96KK2 pKa = 9.5TAIPVNTQGRR12 pKa = 11.84VSGHH16 pKa = 5.49FAKK19 pKa = 10.57APYY22 pKa = 9.41MLVLTDD28 pKa = 3.38EE29 pKa = 4.95GQRR32 pKa = 11.84QWVANPMDD40 pKa = 4.82ADD42 pKa = 4.12RR43 pKa = 11.84CSGRR47 pKa = 11.84CKK49 pKa = 10.49LLAEE53 pKa = 4.69LEE55 pKa = 4.41QAGVTRR61 pKa = 11.84VLVRR65 pKa = 11.84QIGQRR70 pKa = 11.84TLGRR74 pKa = 11.84FLRR77 pKa = 11.84AGLQVYY83 pKa = 9.25RR84 pKa = 11.84LPAGATALPRR94 pKa = 11.84AAAIPAEE101 pKa = 4.2AQALSQASQGRR112 pKa = 11.84PSKK115 pKa = 10.37PRR117 pKa = 11.84ASHH120 pKa = 6.49GEE122 pKa = 4.02GTAGMTGCCGHH133 pKa = 6.85HH134 pKa = 6.35
Molecular weight: 14.23 kDa
Isoelectric point according different methods:
Peptides (in silico digests for buttom-up proteomics)
Below you can find in silico digests of the whole proteome with Trypsin, Chymotrypsin, Trypsin+LysC, LysN, ArgC proteases suitable for different mass spec machines.| Try ESI |
 |
|---|
| ChTry ESI |
 |
|---|
| ArgC ESI |
 |
|---|
| LysN ESI |
 |
|---|
| TryLysC ESI |
 |
|---|
| Try MALDI |
 |
|---|
| ChTry MALDI |
 |
|---|
| ArgC MALDI |
 |
|---|
| LysN MALDI |
 |
|---|
| TryLysC MALDI |
 |
|---|
| Try LTQ |
 |
|---|
| ChTry LTQ |
 |
|---|
| ArgC LTQ |
 |
|---|
| LysN LTQ |
 |
|---|
| TryLysC LTQ |
 |
|---|
| Try MSlow |
 |
|---|
| ChTry MSlow |
 |
|---|
| ArgC MSlow |
 |
|---|
| LysN MSlow |
 |
|---|
| TryLysC MSlow |
 |
|---|
| Try MShigh |
 |
|---|
| ChTry MShigh |
 |
|---|
| ArgC MShigh |
 |
|---|
| LysN MShigh |
 |
|---|
| TryLysC MShigh |
 |
|---|
General Statistics
Number of major isoforms |
Number of additional isoforms |
Number of all proteins |
Number of amino acids |
Min. Seq. Length |
Max. Seq. Length |
Avg. Seq. Length |
Avg. Mol. Weight |
|---|---|---|---|---|---|---|---|
0 |
983950 |
30 |
6062 |
343.8 |
37.78 |
Amino acid frequency
Ala |
Cys |
Asp |
Glu |
Phe |
Gly |
His |
Ile |
Lys |
Leu |
|---|---|---|---|---|---|---|---|---|---|
11.535 ± 0.055 | 0.928 ± 0.018 |
5.951 ± 0.049 | 6.752 ± 0.047 |
3.149 ± 0.029 | 8.783 ± 0.053 |
2.547 ± 0.024 | 4.013 ± 0.033 |
2.108 ± 0.036 | 11.327 ± 0.069 |
Met |
Asn |
Gln |
Pro |
Arg |
Ser |
Thr |
Val |
Trp |
Tyr |
|---|---|---|---|---|---|---|---|---|---|
2.2 ± 0.026 | 2.258 ± 0.023 |
5.504 ± 0.036 | 3.792 ± 0.03 |
8.681 ± 0.059 | 4.415 ± 0.024 |
4.731 ± 0.029 | 7.465 ± 0.042 |
1.53 ± 0.023 | 2.331 ± 0.025 |
Most of the basic statistics you can see at this page can be downloaded from this CSV file
Proteome-pI is available under Creative Commons Attribution-NoDerivs license, for more details see here
| Reference: Kozlowski LP. Proteome-pI 2.0: Proteome Isoelectric Point Database Update. Nucleic Acids Res. 2021, doi: 10.1093/nar/gkab944 | Contact: Lukasz P. Kozlowski |
