Oryza punctata (Red rice)
Taxonomy: cellular organisms; Eukaryota; Viridiplantae; Streptophyta; Streptophytina; Embryophyta; Tracheophyta; Euphyllophyta; Spermatophyta; Magnoliopsida; Mesangiospermae; Liliopsida; Petrosaviidae; commelinids; Poales; Poaceae; BOP clade; Oryzoideae; Oryzeae; Oryzinae; Oryza
Average proteome isoelectric point is 6.86
Get precalculated fractions of proteins

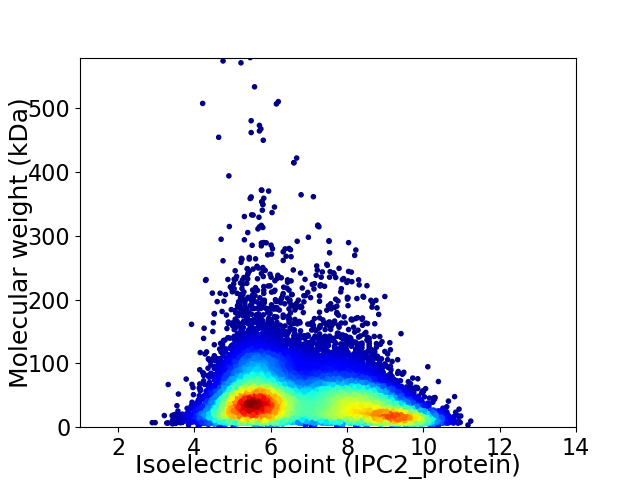
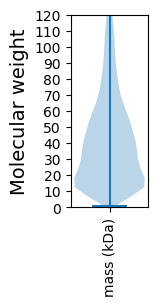
Virtual 2D-PAGE plot for 38431 proteins (isoelectric point calculated using IPC2_protein)
Get csv file with sequences according to given criteria:
* You can choose from 21 different methods for calculating isoelectric point
Summary statistics related to proteome-wise predictions


Protein with the lowest isoelectric point:
>tr|A0A0E0JYC5|A0A0E0JYC5_ORYPU Uncharacterized protein OS=Oryza punctata OX=4537 PE=4 SV=1
MM1 pKa = 7.41EE2 pKa = 6.64CDD4 pKa = 3.34MDD6 pKa = 4.35DD7 pKa = 3.72LRR9 pKa = 11.84HH10 pKa = 6.28RR11 pKa = 11.84LLTVEE16 pKa = 3.99THH18 pKa = 6.74CFDD21 pKa = 3.46HH22 pKa = 6.99HH23 pKa = 7.45HH24 pKa = 7.46DD25 pKa = 3.84GCVVDD30 pKa = 3.82VAGANVAEE38 pKa = 4.23EE39 pKa = 4.31MVLSKK44 pKa = 10.81CVADD48 pKa = 3.77VDD50 pKa = 4.26LTGGKK55 pKa = 9.89DD56 pKa = 3.58LDD58 pKa = 4.03SGLCVLLDD66 pKa = 3.83EE67 pKa = 5.47KK68 pKa = 11.05VCQYY72 pKa = 10.45MIDD75 pKa = 4.3CIVEE79 pKa = 3.88VGVAEE84 pKa = 4.74VYY86 pKa = 10.75AEE88 pKa = 4.14EE89 pKa = 5.4PIVIDD94 pKa = 4.65VSEE97 pKa = 4.48EE98 pKa = 4.03DD99 pKa = 4.95DD100 pKa = 4.86DD101 pKa = 5.96GSDD104 pKa = 4.45YY105 pKa = 10.9EE106 pKa = 5.41LEE108 pKa = 4.19MAKK111 pKa = 10.54DD112 pKa = 3.56HH113 pKa = 6.86ANEE116 pKa = 4.42DD117 pKa = 3.93SEE119 pKa = 4.71EE120 pKa = 4.2DD121 pKa = 3.65EE122 pKa = 4.45PVNGNGDD129 pKa = 3.8EE130 pKa = 4.11PVKK133 pKa = 11.23GNGNEE138 pKa = 3.71EE139 pKa = 4.09DD140 pKa = 3.82EE141 pKa = 4.44PVNGNEE147 pKa = 5.31DD148 pKa = 3.88EE149 pKa = 4.5PLHH152 pKa = 6.21
MM1 pKa = 7.41EE2 pKa = 6.64CDD4 pKa = 3.34MDD6 pKa = 4.35DD7 pKa = 3.72LRR9 pKa = 11.84HH10 pKa = 6.28RR11 pKa = 11.84LLTVEE16 pKa = 3.99THH18 pKa = 6.74CFDD21 pKa = 3.46HH22 pKa = 6.99HH23 pKa = 7.45HH24 pKa = 7.46DD25 pKa = 3.84GCVVDD30 pKa = 3.82VAGANVAEE38 pKa = 4.23EE39 pKa = 4.31MVLSKK44 pKa = 10.81CVADD48 pKa = 3.77VDD50 pKa = 4.26LTGGKK55 pKa = 9.89DD56 pKa = 3.58LDD58 pKa = 4.03SGLCVLLDD66 pKa = 3.83EE67 pKa = 5.47KK68 pKa = 11.05VCQYY72 pKa = 10.45MIDD75 pKa = 4.3CIVEE79 pKa = 3.88VGVAEE84 pKa = 4.74VYY86 pKa = 10.75AEE88 pKa = 4.14EE89 pKa = 5.4PIVIDD94 pKa = 4.65VSEE97 pKa = 4.48EE98 pKa = 4.03DD99 pKa = 4.95DD100 pKa = 4.86DD101 pKa = 5.96GSDD104 pKa = 4.45YY105 pKa = 10.9EE106 pKa = 5.41LEE108 pKa = 4.19MAKK111 pKa = 10.54DD112 pKa = 3.56HH113 pKa = 6.86ANEE116 pKa = 4.42DD117 pKa = 3.93SEE119 pKa = 4.71EE120 pKa = 4.2DD121 pKa = 3.65EE122 pKa = 4.45PVNGNGDD129 pKa = 3.8EE130 pKa = 4.11PVKK133 pKa = 11.23GNGNEE138 pKa = 3.71EE139 pKa = 4.09DD140 pKa = 3.82EE141 pKa = 4.44PVNGNEE147 pKa = 5.31DD148 pKa = 3.88EE149 pKa = 4.5PLHH152 pKa = 6.21
Molecular weight: 16.66 kDa
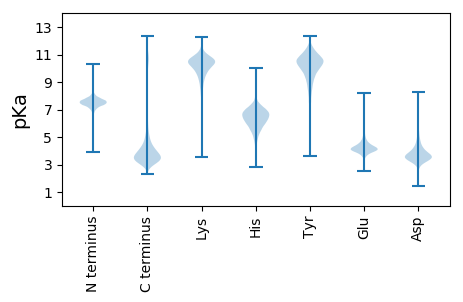
Isoelectric point according different methods:
Protein with the highest isoelectric point:
>tr|A0A0E0MEI5|A0A0E0MEI5_ORYPU Uncharacterized protein OS=Oryza punctata OX=4537 PE=4 SV=1
MM1 pKa = 7.83PSLTTGRR8 pKa = 11.84SPWRR12 pKa = 11.84RR13 pKa = 11.84RR14 pKa = 11.84KK15 pKa = 10.16RR16 pKa = 11.84GTPAVGTTTARR27 pKa = 11.84RR28 pKa = 11.84RR29 pKa = 11.84RR30 pKa = 11.84TPTSLRR36 pKa = 11.84ALWRR40 pKa = 11.84RR41 pKa = 11.84IVPRR45 pKa = 11.84TSTTTAPRR53 pKa = 11.84VRR55 pKa = 11.84TRR57 pKa = 11.84KK58 pKa = 9.6PGLLSRR64 pKa = 11.84AFRR67 pKa = 11.84VLSCGGGRR75 pKa = 11.84RR76 pKa = 11.84SRR78 pKa = 11.84AARR81 pKa = 11.84RR82 pKa = 11.84WW83 pKa = 3.29
MM1 pKa = 7.83PSLTTGRR8 pKa = 11.84SPWRR12 pKa = 11.84RR13 pKa = 11.84RR14 pKa = 11.84KK15 pKa = 10.16RR16 pKa = 11.84GTPAVGTTTARR27 pKa = 11.84RR28 pKa = 11.84RR29 pKa = 11.84RR30 pKa = 11.84TPTSLRR36 pKa = 11.84ALWRR40 pKa = 11.84RR41 pKa = 11.84IVPRR45 pKa = 11.84TSTTTAPRR53 pKa = 11.84VRR55 pKa = 11.84TRR57 pKa = 11.84KK58 pKa = 9.6PGLLSRR64 pKa = 11.84AFRR67 pKa = 11.84VLSCGGGRR75 pKa = 11.84RR76 pKa = 11.84SRR78 pKa = 11.84AARR81 pKa = 11.84RR82 pKa = 11.84WW83 pKa = 3.29
Molecular weight: 9.5 kDa
Isoelectric point according different methods:
Peptides (in silico digests for buttom-up proteomics)
Below you can find in silico digests of the whole proteome with Trypsin, Chymotrypsin, Trypsin+LysC, LysN, ArgC proteases suitable for different mass spec machines.| Try ESI |
 |
|---|
| ChTry ESI |
 |
|---|
| ArgC ESI |
 |
|---|
| LysN ESI |
 |
|---|
| TryLysC ESI |
 |
|---|
| Try MALDI |
 |
|---|
| ChTry MALDI |
 |
|---|
| ArgC MALDI |
 |
|---|
| LysN MALDI |
 |
|---|
| TryLysC MALDI |
 |
|---|
| Try LTQ |
 |
|---|
| ChTry LTQ |
 |
|---|
| ArgC LTQ |
 |
|---|
| LysN LTQ |
 |
|---|
| TryLysC LTQ |
 |
|---|
| Try MSlow |
 |
|---|
| ChTry MSlow |
 |
|---|
| ArgC MSlow |
 |
|---|
| LysN MSlow |
 |
|---|
| TryLysC MSlow |
 |
|---|
| Try MShigh |
 |
|---|
| ChTry MShigh |
 |
|---|
| ArgC MShigh |
 |
|---|
| LysN MShigh |
 |
|---|
| TryLysC MShigh |
 |
|---|
General Statistics
Number of major isoforms |
Number of additional isoforms |
Number of all proteins |
Number of amino acids |
Min. Seq. Length |
Max. Seq. Length |
Avg. Seq. Length |
Avg. Mol. Weight |
|---|---|---|---|---|---|---|---|
16585171 |
7 |
5284 |
431.6 |
47.53 |
Amino acid frequency
Ala |
Cys |
Asp |
Glu |
Phe |
Gly |
His |
Ile |
Lys |
Leu |
|---|---|---|---|---|---|---|---|---|---|
8.955 ± 0.017 | 1.904 ± 0.007 |
5.437 ± 0.009 | 6.05 ± 0.015 |
3.666 ± 0.009 | 7.272 ± 0.015 |
2.51 ± 0.005 | 4.54 ± 0.01 |
4.988 ± 0.012 | 9.509 ± 0.016 |
Met |
Asn |
Gln |
Pro |
Arg |
Ser |
Thr |
Val |
Trp |
Tyr |
|---|---|---|---|---|---|---|---|---|---|
2.449 ± 0.005 | 3.644 ± 0.009 |
5.489 ± 0.013 | 3.455 ± 0.01 |
6.213 ± 0.01 | 8.383 ± 0.015 |
4.858 ± 0.007 | 6.776 ± 0.009 |
1.3 ± 0.004 | 2.602 ± 0.007 |
Most of the basic statistics you can see at this page can be downloaded from this CSV file
Proteome-pI is available under Creative Commons Attribution-NoDerivs license, for more details see here
| Reference: Kozlowski LP. Proteome-pI 2.0: Proteome Isoelectric Point Database Update. Nucleic Acids Res. 2021, doi: 10.1093/nar/gkab944 | Contact: Lukasz P. Kozlowski |
