Streptomyces sp. ADI93-02
Taxonomy: cellular organisms; Bacteria; Terrabacteria group; Actinobacteria; Actinomycetia; Streptomycetales; Streptomycetaceae; Streptomyces; unclassified Streptomyces
Average proteome isoelectric point is 6.32
Get precalculated fractions of proteins
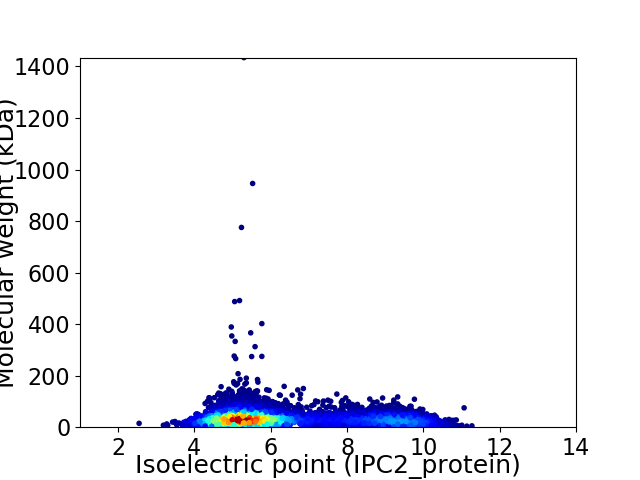
Virtual 2D-PAGE plot for 7315 proteins (isoelectric point calculated using IPC2_protein)
Get csv file with sequences according to given criteria:
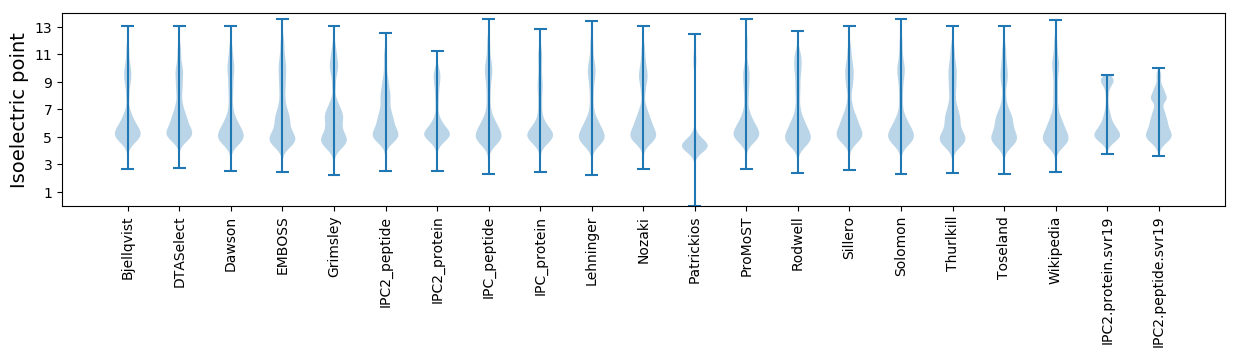
* You can choose from 21 different methods for calculating isoelectric point
Summary statistics related to proteome-wise predictions
Protein with the lowest isoelectric point:
>tr|A0A3N6DE50|A0A3N6DE50_9ACTN Virulence regulon transcriptional activator VirF OS=Streptomyces sp. ADI93-02 OX=1522757 GN=virF3 PE=4 SV=1
MM1 pKa = 6.86NTGPLRR7 pKa = 11.84VSVDD11 pKa = 3.09TDD13 pKa = 3.42ACCAMGRR20 pKa = 11.84CADD23 pKa = 3.68TEE25 pKa = 4.15PRR27 pKa = 11.84VFDD30 pKa = 3.53QDD32 pKa = 3.33EE33 pKa = 4.26DD34 pKa = 3.96TGTVVLLQAAPPPDD48 pKa = 3.23LHH50 pKa = 6.75DD51 pKa = 3.68TVRR54 pKa = 11.84LCAEE58 pKa = 4.98LCPCTAITVTEE69 pKa = 4.17EE70 pKa = 3.64
MM1 pKa = 6.86NTGPLRR7 pKa = 11.84VSVDD11 pKa = 3.09TDD13 pKa = 3.42ACCAMGRR20 pKa = 11.84CADD23 pKa = 3.68TEE25 pKa = 4.15PRR27 pKa = 11.84VFDD30 pKa = 3.53QDD32 pKa = 3.33EE33 pKa = 4.26DD34 pKa = 3.96TGTVVLLQAAPPPDD48 pKa = 3.23LHH50 pKa = 6.75DD51 pKa = 3.68TVRR54 pKa = 11.84LCAEE58 pKa = 4.98LCPCTAITVTEE69 pKa = 4.17EE70 pKa = 3.64
Molecular weight: 7.48 kDa
Isoelectric point according different methods:
Protein with the highest isoelectric point:
>tr|A0A3N6E6K0|A0A3N6E6K0_9ACTN Putative L D-transpeptidase LppS OS=Streptomyces sp. ADI93-02 OX=1522757 GN=lppS4 PE=4 SV=1
MM1 pKa = 7.69SKK3 pKa = 9.0RR4 pKa = 11.84TFQPNNRR11 pKa = 11.84RR12 pKa = 11.84RR13 pKa = 11.84AKK15 pKa = 8.7THH17 pKa = 5.15GFRR20 pKa = 11.84LRR22 pKa = 11.84MRR24 pKa = 11.84TRR26 pKa = 11.84AGRR29 pKa = 11.84AILANRR35 pKa = 11.84RR36 pKa = 11.84GKK38 pKa = 10.51GRR40 pKa = 11.84ANLSAA45 pKa = 4.66
MM1 pKa = 7.69SKK3 pKa = 9.0RR4 pKa = 11.84TFQPNNRR11 pKa = 11.84RR12 pKa = 11.84RR13 pKa = 11.84AKK15 pKa = 8.7THH17 pKa = 5.15GFRR20 pKa = 11.84LRR22 pKa = 11.84MRR24 pKa = 11.84TRR26 pKa = 11.84AGRR29 pKa = 11.84AILANRR35 pKa = 11.84RR36 pKa = 11.84GKK38 pKa = 10.51GRR40 pKa = 11.84ANLSAA45 pKa = 4.66
Molecular weight: 5.24 kDa
Isoelectric point according different methods:
Peptides (in silico digests for buttom-up proteomics)
Below you can find in silico digests of the whole proteome with Trypsin, Chymotrypsin, Trypsin+LysC, LysN, ArgC proteases suitable for different mass spec machines.| Try ESI |
 |
|---|
| ChTry ESI |
|
|---|
| ArgC ESI |
|
|---|
| LysN ESI |
|
|---|
| TryLysC ESI |
|
|---|
| Try MALDI |
|
|---|
| ChTry MALDI |
|
|---|
| ArgC MALDI |
|
|---|
| LysN MALDI |
|
|---|
| TryLysC MALDI |
|
|---|
| Try LTQ |
|
|---|
| ChTry LTQ |
|
|---|
| ArgC LTQ |
|
|---|
| LysN LTQ |
|
|---|
| TryLysC LTQ |
|
|---|
| Try MSlow |
|
|---|
| ChTry MSlow |
|
|---|
| ArgC MSlow |
|
|---|
| LysN MSlow |
|
|---|
| TryLysC MSlow |
|
|---|
| Try MShigh |
|
|---|
| ChTry MShigh |
|
|---|
| ArgC MShigh |
|
|---|
| LysN MShigh |
|
|---|
| TryLysC MShigh |
|
|---|
General Statistics
Number of major isoforms |
Number of additional isoforms |
Number of all proteins |
Number of amino acids |
Min. Seq. Length |
Max. Seq. Length |
Avg. Seq. Length |
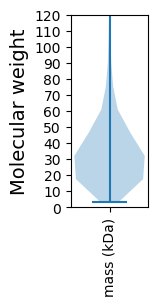
Avg. Mol. Weight |
|---|---|---|---|---|---|---|---|
0 |
2400191 |
29 |
13431 |
328.1 |
35.06 |
Amino acid frequency
Ala |
Cys |
Asp |
Glu |
Phe |
Gly |
His |
Ile |
Lys |
Leu |
|---|---|---|---|---|---|---|---|---|---|
13.517 ± 0.037 | 0.759 ± 0.01 |
5.983 ± 0.024 | 5.728 ± 0.028 |
2.739 ± 0.014 | 9.651 ± 0.027 |
2.279 ± 0.013 | 3.179 ± 0.02 |
2.167 ± 0.026 | 10.309 ± 0.036 |
Met |
Asn |
Gln |
Pro |
Arg |
Ser |
Thr |
Val |
Trp |
Tyr |
|---|---|---|---|---|---|---|---|---|---|
1.796 ± 0.011 | 1.737 ± 0.016 |
6.114 ± 0.028 | 2.734 ± 0.017 |
7.915 ± 0.029 | 5.268 ± 0.021 |
6.183 ± 0.022 | 8.391 ± 0.025 |
1.48 ± 0.013 | 2.071 ± 0.012 |
Most of the basic statistics you can see at this page can be downloaded from this CSV file
See this proteome in:

Proteome-pI is available under Creative Commons Attribution-NoDerivs license, for more details see here
| Reference: Kozlowski LP. Proteome-pI 2.0: Proteome Isoelectric Point Database Update. Nucleic Acids Res. 2021, doi: 10.1093/nar/gkab944 | Contact: Lukasz P. Kozlowski |