Klebsiella michiganensis
Taxonomy: cellular organisms; Bacteria; Proteobacteria; Gammaproteobacteria; Enterobacterales; Enterobacteriaceae; Klebsiella
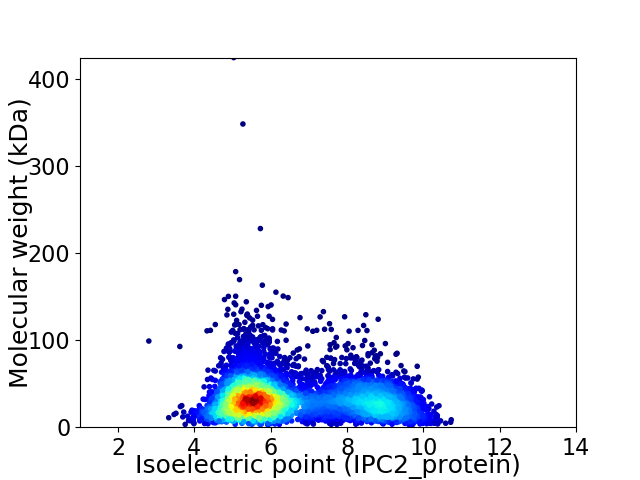
Average proteome isoelectric point is 6.58
Get precalculated fractions of proteins

Virtual 2D-PAGE plot for 5696 proteins (isoelectric point calculated using IPC2_protein)
Get csv file with sequences according to given criteria:
* You can choose from 21 different methods for calculating isoelectric point
Summary statistics related to proteome-wise predictions


Protein with the lowest isoelectric point:
>tr|A0A0J2KMH4|A0A0J2KMH4_9ENTR Thioredoxin OS=Klebsiella michiganensis OX=1134687 GN=AGG97_30660 PE=4 SV=1
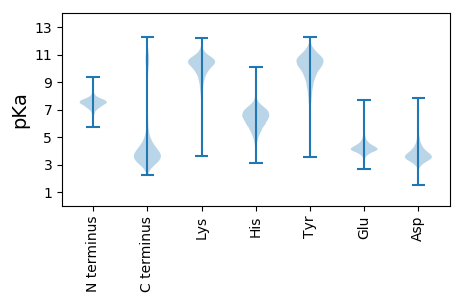
MM1 pKa = 7.67NIGLFYY7 pKa = 10.91GSSTCYY13 pKa = 10.49TEE15 pKa = 3.84MAAEE19 pKa = 5.12KK20 pKa = 10.0IRR22 pKa = 11.84DD23 pKa = 3.65IIGPEE28 pKa = 4.02LVTLHH33 pKa = 6.12NLKK36 pKa = 10.49DD37 pKa = 3.85DD38 pKa = 4.22SPALMTQYY46 pKa = 11.26DD47 pKa = 4.24VLILGIPTWDD57 pKa = 3.26FGEE60 pKa = 4.22IQEE63 pKa = 4.43DD64 pKa = 4.16WEE66 pKa = 4.67AVWQQLDD73 pKa = 3.72TLDD76 pKa = 3.83LQGKK80 pKa = 8.79IVALYY85 pKa = 11.07GMGDD89 pKa = 3.29QLGYY93 pKa = 11.02GEE95 pKa = 4.87WFLDD99 pKa = 3.74ALGMLHH105 pKa = 7.54DD106 pKa = 4.49KK107 pKa = 10.83LATKK111 pKa = 9.99GVKK114 pKa = 10.29FIGYY118 pKa = 8.15WPTEE122 pKa = 4.1GYY124 pKa = 10.61EE125 pKa = 4.19FTSPKK130 pKa = 10.02PVIADD135 pKa = 3.41GQLFVGLALDD145 pKa = 3.64EE146 pKa = 4.38TNQYY150 pKa = 10.89DD151 pKa = 4.3LSDD154 pKa = 3.47EE155 pKa = 5.47RR156 pKa = 11.84IQNWCEE162 pKa = 3.76QILGEE167 pKa = 4.15MAEE170 pKa = 4.24QFSS173 pKa = 3.85
MM1 pKa = 7.67NIGLFYY7 pKa = 10.91GSSTCYY13 pKa = 10.49TEE15 pKa = 3.84MAAEE19 pKa = 5.12KK20 pKa = 10.0IRR22 pKa = 11.84DD23 pKa = 3.65IIGPEE28 pKa = 4.02LVTLHH33 pKa = 6.12NLKK36 pKa = 10.49DD37 pKa = 3.85DD38 pKa = 4.22SPALMTQYY46 pKa = 11.26DD47 pKa = 4.24VLILGIPTWDD57 pKa = 3.26FGEE60 pKa = 4.22IQEE63 pKa = 4.43DD64 pKa = 4.16WEE66 pKa = 4.67AVWQQLDD73 pKa = 3.72TLDD76 pKa = 3.83LQGKK80 pKa = 8.79IVALYY85 pKa = 11.07GMGDD89 pKa = 3.29QLGYY93 pKa = 11.02GEE95 pKa = 4.87WFLDD99 pKa = 3.74ALGMLHH105 pKa = 7.54DD106 pKa = 4.49KK107 pKa = 10.83LATKK111 pKa = 9.99GVKK114 pKa = 10.29FIGYY118 pKa = 8.15WPTEE122 pKa = 4.1GYY124 pKa = 10.61EE125 pKa = 4.19FTSPKK130 pKa = 10.02PVIADD135 pKa = 3.41GQLFVGLALDD145 pKa = 3.64EE146 pKa = 4.38TNQYY150 pKa = 10.89DD151 pKa = 4.3LSDD154 pKa = 3.47EE155 pKa = 5.47RR156 pKa = 11.84IQNWCEE162 pKa = 3.76QILGEE167 pKa = 4.15MAEE170 pKa = 4.24QFSS173 pKa = 3.85
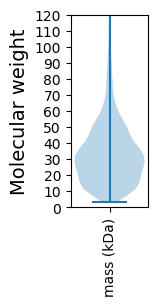
Molecular weight: 19.57 kDa
Isoelectric point according different methods:
Protein with the highest isoelectric point:
>tr|A0A384I3E9|A0A384I3E9_9ENTR Head-tail adaptor protein OS=Klebsiella michiganensis OX=1134687 GN=SAMEA2273883_00822 PE=4 SV=1
MM1 pKa = 7.57ASVSISCPSCSATDD15 pKa = 3.7GVVRR19 pKa = 11.84NGKK22 pKa = 8.27STAGHH27 pKa = 4.88QRR29 pKa = 11.84YY30 pKa = 8.94LCSHH34 pKa = 6.46CRR36 pKa = 11.84KK37 pKa = 7.49TWQLQFTYY45 pKa = 9.73TASQPGTHH53 pKa = 6.22QKK55 pKa = 8.02ITDD58 pKa = 3.34MAMNGVGCRR67 pKa = 11.84ASARR71 pKa = 11.84IMGVGLNTVLRR82 pKa = 11.84HH83 pKa = 5.87LKK85 pKa = 10.37NSGRR89 pKa = 11.84SRR91 pKa = 3.37
MM1 pKa = 7.57ASVSISCPSCSATDD15 pKa = 3.7GVVRR19 pKa = 11.84NGKK22 pKa = 8.27STAGHH27 pKa = 4.88QRR29 pKa = 11.84YY30 pKa = 8.94LCSHH34 pKa = 6.46CRR36 pKa = 11.84KK37 pKa = 7.49TWQLQFTYY45 pKa = 9.73TASQPGTHH53 pKa = 6.22QKK55 pKa = 8.02ITDD58 pKa = 3.34MAMNGVGCRR67 pKa = 11.84ASARR71 pKa = 11.84IMGVGLNTVLRR82 pKa = 11.84HH83 pKa = 5.87LKK85 pKa = 10.37NSGRR89 pKa = 11.84SRR91 pKa = 3.37
Molecular weight: 9.83 kDa
Isoelectric point according different methods:
Peptides (in silico digests for buttom-up proteomics)
Below you can find in silico digests of the whole proteome with Trypsin, Chymotrypsin, Trypsin+LysC, LysN, ArgC proteases suitable for different mass spec machines.| Try ESI |
 |
|---|
| ChTry ESI |
 |
|---|
| ArgC ESI |
 |
|---|
| LysN ESI |
 |
|---|
| TryLysC ESI |
 |
|---|
| Try MALDI |
 |
|---|
| ChTry MALDI |
 |
|---|
| ArgC MALDI |
 |
|---|
| LysN MALDI |
 |
|---|
| TryLysC MALDI |
 |
|---|
| Try LTQ |
 |
|---|
| ChTry LTQ |
 |
|---|
| ArgC LTQ |
 |
|---|
| LysN LTQ |
 |
|---|
| TryLysC LTQ |
 |
|---|
| Try MSlow |
 |
|---|
| ChTry MSlow |
 |
|---|
| ArgC MSlow |
 |
|---|
| LysN MSlow |
 |
|---|
| TryLysC MSlow |
 |
|---|
| Try MShigh |
 |
|---|
| ChTry MShigh |
 |
|---|
| ArgC MShigh |
 |
|---|
| LysN MShigh |
 |
|---|
| TryLysC MShigh |
 |
|---|
General Statistics
Number of major isoforms |
Number of additional isoforms |
Number of all proteins |
Number of amino acids |
Min. Seq. Length |
Max. Seq. Length |
Avg. Seq. Length |
Avg. Mol. Weight |
|---|---|---|---|---|---|---|---|
0 |
1795927 |
29 |
3993 |
315.3 |
34.8 |
Amino acid frequency
Ala |
Cys |
Asp |
Glu |
Phe |
Gly |
His |
Ile |
Lys |
Leu |
|---|---|---|---|---|---|---|---|---|---|
10.181 ± 0.04 | 1.092 ± 0.014 |
5.11 ± 0.028 | 5.52 ± 0.029 |
3.888 ± 0.019 | 7.562 ± 0.03 |
2.232 ± 0.017 | 5.77 ± 0.026 |
4.003 ± 0.026 | 10.95 ± 0.042 |
Met |
Asn |
Gln |
Pro |
Arg |
Ser |
Thr |
Val |
Trp |
Tyr |
|---|---|---|---|---|---|---|---|---|---|
2.746 ± 0.015 | 3.579 ± 0.022 |
4.531 ± 0.024 | 4.4 ± 0.026 |
5.856 ± 0.028 | 6.002 ± 0.033 |
5.214 ± 0.022 | 7.006 ± 0.028 |
1.582 ± 0.014 | 2.776 ± 0.018 |
Most of the basic statistics you can see at this page can be downloaded from this CSV file
Proteome-pI is available under Creative Commons Attribution-NoDerivs license, for more details see here
| Reference: Kozlowski LP. Proteome-pI 2.0: Proteome Isoelectric Point Database Update. Nucleic Acids Res. 2021, doi: 10.1093/nar/gkab944 | Contact: Lukasz P. Kozlowski |
