Sunxiuqinia elliptica
Taxonomy: cellular organisms; Bacteria; FCB group; Bacteroidetes/Chlorobi group; Bacteroidetes; Bacteroidia; Marinilabiliales; Prolixibacteraceae; Sunxiuqinia
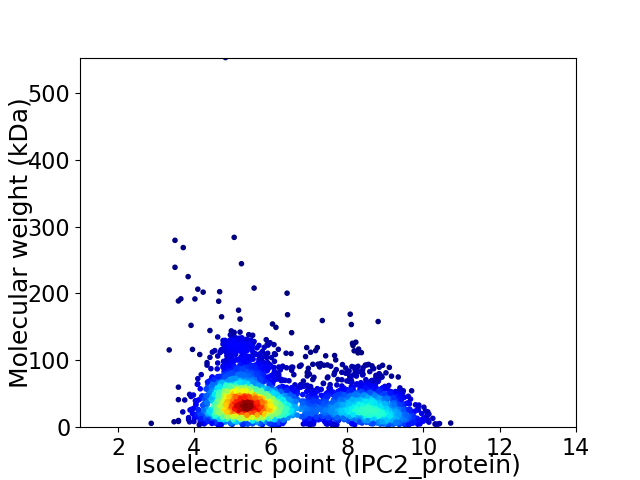
Average proteome isoelectric point is 6.27
Get precalculated fractions of proteins

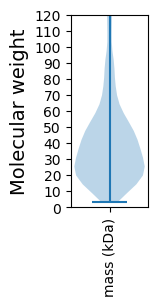
Virtual 2D-PAGE plot for 4090 proteins (isoelectric point calculated using IPC2_protein)
Get csv file with sequences according to given criteria:
* You can choose from 21 different methods for calculating isoelectric point
Summary statistics related to proteome-wise predictions


Protein with the lowest isoelectric point:
>tr|A0A1I2D559|A0A1I2D559_9BACT FecR family protein OS=Sunxiuqinia elliptica OX=655355 GN=SAMN05216283_101927 PE=4 SV=1
MM1 pKa = 7.66KK2 pKa = 10.36KK3 pKa = 10.2QILTLTLFVLAIFAGSYY20 pKa = 10.22SVFGQATVLNQAITASQPIPALSCVAGSEE49 pKa = 4.14PLHH52 pKa = 6.57PYY54 pKa = 9.48PGQSYY59 pKa = 8.09TYY61 pKa = 10.2TMDD64 pKa = 3.5GSSGAEE70 pKa = 4.08TADD73 pKa = 2.86EE74 pKa = 4.23WTWFVTKK81 pKa = 10.59DD82 pKa = 3.46PEE84 pKa = 4.71FINATGLNTANMLTTASGDD103 pKa = 3.71LLNVGTNYY111 pKa = 8.41GTATAGANSIDD122 pKa = 3.79ITWSPEE128 pKa = 3.52VLANTLYY135 pKa = 10.66QGTPGTDD142 pKa = 3.35PSPTFVVGYY151 pKa = 8.47ATGTNCADD159 pKa = 3.82NIQVYY164 pKa = 9.58EE165 pKa = 4.34INPKK169 pKa = 10.28FNFTIDD175 pKa = 3.03IANVDD180 pKa = 4.22TVNSTLGWDD189 pKa = 3.46AAFSQCVDD197 pKa = 3.06IVRR200 pKa = 11.84SATYY204 pKa = 10.76NSTTKK209 pKa = 10.55EE210 pKa = 3.25IDD212 pKa = 3.17VNYY215 pKa = 10.5GKK217 pKa = 10.37DD218 pKa = 2.89ILYY221 pKa = 10.75FEE223 pKa = 4.4VAAANFVTDD232 pKa = 3.93FTPTFHH238 pKa = 7.37LISGLVGTQTAVVTLHH254 pKa = 7.0PSLADD259 pKa = 3.41AKK261 pKa = 10.98AGTNVAATANWDD273 pKa = 3.58ATSVGTDD280 pKa = 2.81WATGVQFTSSDD291 pKa = 3.5PALVVSGVSLFVKK304 pKa = 9.84VVISNNTEE312 pKa = 3.44EE313 pKa = 4.76SLTDD317 pKa = 3.78NIFALAVDD325 pKa = 4.04AQDD328 pKa = 4.08NNQTGIWDD336 pKa = 4.2MEE338 pKa = 5.12DD339 pKa = 4.14DD340 pKa = 4.56DD341 pKa = 5.08CTTATDD347 pKa = 4.18AADD350 pKa = 3.35QADD353 pKa = 4.2FAEE356 pKa = 4.72HH357 pKa = 6.07TVTPRR362 pKa = 11.84PQIDD366 pKa = 3.77HH367 pKa = 6.61ATPDD371 pKa = 3.51AGAPDD376 pKa = 4.35PTTVITKK383 pKa = 8.64TPP385 pKa = 3.31
MM1 pKa = 7.66KK2 pKa = 10.36KK3 pKa = 10.2QILTLTLFVLAIFAGSYY20 pKa = 10.22SVFGQATVLNQAITASQPIPALSCVAGSEE49 pKa = 4.14PLHH52 pKa = 6.57PYY54 pKa = 9.48PGQSYY59 pKa = 8.09TYY61 pKa = 10.2TMDD64 pKa = 3.5GSSGAEE70 pKa = 4.08TADD73 pKa = 2.86EE74 pKa = 4.23WTWFVTKK81 pKa = 10.59DD82 pKa = 3.46PEE84 pKa = 4.71FINATGLNTANMLTTASGDD103 pKa = 3.71LLNVGTNYY111 pKa = 8.41GTATAGANSIDD122 pKa = 3.79ITWSPEE128 pKa = 3.52VLANTLYY135 pKa = 10.66QGTPGTDD142 pKa = 3.35PSPTFVVGYY151 pKa = 8.47ATGTNCADD159 pKa = 3.82NIQVYY164 pKa = 9.58EE165 pKa = 4.34INPKK169 pKa = 10.28FNFTIDD175 pKa = 3.03IANVDD180 pKa = 4.22TVNSTLGWDD189 pKa = 3.46AAFSQCVDD197 pKa = 3.06IVRR200 pKa = 11.84SATYY204 pKa = 10.76NSTTKK209 pKa = 10.55EE210 pKa = 3.25IDD212 pKa = 3.17VNYY215 pKa = 10.5GKK217 pKa = 10.37DD218 pKa = 2.89ILYY221 pKa = 10.75FEE223 pKa = 4.4VAAANFVTDD232 pKa = 3.93FTPTFHH238 pKa = 7.37LISGLVGTQTAVVTLHH254 pKa = 7.0PSLADD259 pKa = 3.41AKK261 pKa = 10.98AGTNVAATANWDD273 pKa = 3.58ATSVGTDD280 pKa = 2.81WATGVQFTSSDD291 pKa = 3.5PALVVSGVSLFVKK304 pKa = 9.84VVISNNTEE312 pKa = 3.44EE313 pKa = 4.76SLTDD317 pKa = 3.78NIFALAVDD325 pKa = 4.04AQDD328 pKa = 4.08NNQTGIWDD336 pKa = 4.2MEE338 pKa = 5.12DD339 pKa = 4.14DD340 pKa = 4.56DD341 pKa = 5.08CTTATDD347 pKa = 4.18AADD350 pKa = 3.35QADD353 pKa = 4.2FAEE356 pKa = 4.72HH357 pKa = 6.07TVTPRR362 pKa = 11.84PQIDD366 pKa = 3.77HH367 pKa = 6.61ATPDD371 pKa = 3.51AGAPDD376 pKa = 4.35PTTVITKK383 pKa = 8.64TPP385 pKa = 3.31
Molecular weight: 40.67 kDa
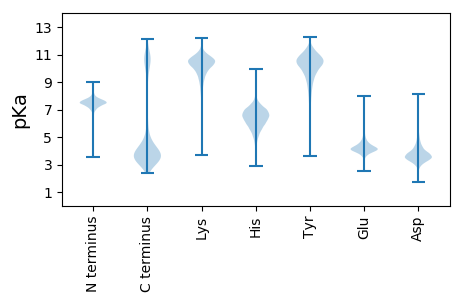
Isoelectric point according different methods:
Protein with the highest isoelectric point:
>tr|A0A1I2ASV1|A0A1I2ASV1_9BACT Sporulation related domain-containing protein OS=Sunxiuqinia elliptica OX=655355 GN=SAMN05216283_101215 PE=4 SV=1
MM1 pKa = 7.45KK2 pKa = 9.61RR3 pKa = 11.84TFQPSNRR10 pKa = 11.84KK11 pKa = 8.89RR12 pKa = 11.84RR13 pKa = 11.84NKK15 pKa = 10.06HH16 pKa = 3.64GFRR19 pKa = 11.84AKK21 pKa = 9.35MASTSGRR28 pKa = 11.84KK29 pKa = 8.27VLKK32 pKa = 10.26LRR34 pKa = 11.84RR35 pKa = 11.84AKK37 pKa = 10.12GRR39 pKa = 11.84KK40 pKa = 8.74KK41 pKa = 10.01LTVSDD46 pKa = 4.02EE47 pKa = 4.2PRR49 pKa = 11.84HH50 pKa = 5.57KK51 pKa = 10.63RR52 pKa = 3.34
MM1 pKa = 7.45KK2 pKa = 9.61RR3 pKa = 11.84TFQPSNRR10 pKa = 11.84KK11 pKa = 8.89RR12 pKa = 11.84RR13 pKa = 11.84NKK15 pKa = 10.06HH16 pKa = 3.64GFRR19 pKa = 11.84AKK21 pKa = 9.35MASTSGRR28 pKa = 11.84KK29 pKa = 8.27VLKK32 pKa = 10.26LRR34 pKa = 11.84RR35 pKa = 11.84AKK37 pKa = 10.12GRR39 pKa = 11.84KK40 pKa = 8.74KK41 pKa = 10.01LTVSDD46 pKa = 4.02EE47 pKa = 4.2PRR49 pKa = 11.84HH50 pKa = 5.57KK51 pKa = 10.63RR52 pKa = 3.34
Molecular weight: 6.22 kDa
Isoelectric point according different methods:
Peptides (in silico digests for buttom-up proteomics)
Below you can find in silico digests of the whole proteome with Trypsin, Chymotrypsin, Trypsin+LysC, LysN, ArgC proteases suitable for different mass spec machines.| Try ESI |
 |
|---|
| ChTry ESI |
 |
|---|
| ArgC ESI |
 |
|---|
| LysN ESI |
 |
|---|
| TryLysC ESI |
 |
|---|
| Try MALDI |
 |
|---|
| ChTry MALDI |
 |
|---|
| ArgC MALDI |
 |
|---|
| LysN MALDI |
 |
|---|
| TryLysC MALDI |
 |
|---|
| Try LTQ |
 |
|---|
| ChTry LTQ |
 |
|---|
| ArgC LTQ |
 |
|---|
| LysN LTQ |
 |
|---|
| TryLysC LTQ |
 |
|---|
| Try MSlow |
 |
|---|
| ChTry MSlow |
 |
|---|
| ArgC MSlow |
 |
|---|
| LysN MSlow |
 |
|---|
| TryLysC MSlow |
 |
|---|
| Try MShigh |
 |
|---|
| ChTry MShigh |
 |
|---|
| ArgC MShigh |
 |
|---|
| LysN MShigh |
 |
|---|
| TryLysC MShigh |
 |
|---|
General Statistics
Number of major isoforms |
Number of additional isoforms |
Number of all proteins |
Number of amino acids |
Min. Seq. Length |
Max. Seq. Length |
Avg. Seq. Length |
Avg. Mol. Weight |
|---|---|---|---|---|---|---|---|
0 |
1510668 |
29 |
5174 |
369.4 |
41.67 |
Amino acid frequency
Ala |
Cys |
Asp |
Glu |
Phe |
Gly |
His |
Ile |
Lys |
Leu |
|---|---|---|---|---|---|---|---|---|---|
6.889 ± 0.035 | 0.823 ± 0.013 |
5.526 ± 0.028 | 6.852 ± 0.035 |
5.002 ± 0.026 | 6.819 ± 0.037 |
1.926 ± 0.019 | 6.87 ± 0.037 |
6.619 ± 0.037 | 9.674 ± 0.045 |
Met |
Asn |
Gln |
Pro |
Arg |
Ser |
Thr |
Val |
Trp |
Tyr |
|---|---|---|---|---|---|---|---|---|---|
2.328 ± 0.017 | 5.207 ± 0.033 |
3.765 ± 0.023 | 4.095 ± 0.031 |
4.152 ± 0.027 | 6.373 ± 0.031 |
5.235 ± 0.043 | 6.46 ± 0.032 |
1.341 ± 0.016 | 4.041 ± 0.027 |
Most of the basic statistics you can see at this page can be downloaded from this CSV file
Proteome-pI is available under Creative Commons Attribution-NoDerivs license, for more details see here
| Reference: Kozlowski LP. Proteome-pI 2.0: Proteome Isoelectric Point Database Update. Nucleic Acids Res. 2021, doi: 10.1093/nar/gkab944 | Contact: Lukasz P. Kozlowski |
