Actinidia virus X
Taxonomy: Viruses; Riboviria; Orthornavirae; Kitrinoviricota; Alsuviricetes; Tymovirales; Alphaflexiviridae; Potexvirus
Average proteome isoelectric point is 6.84
Get precalculated fractions of proteins

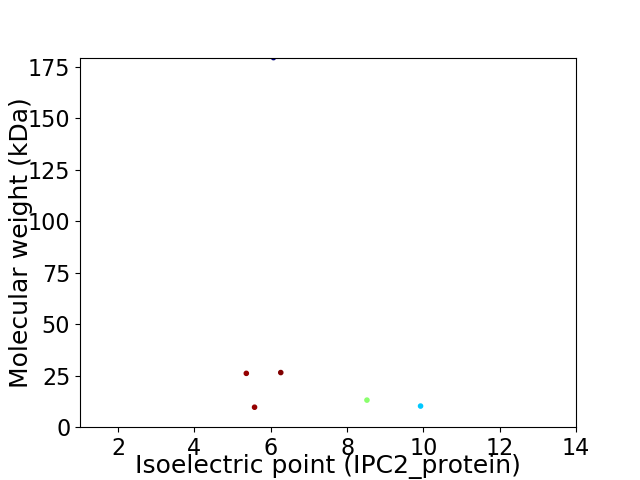
Virtual 2D-PAGE plot for 6 proteins (isoelectric point calculated using IPC2_protein)
Get csv file with sequences according to given criteria:
* You can choose from 21 different methods for calculating isoelectric point
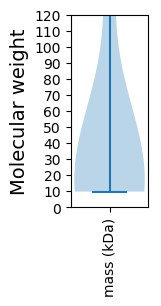
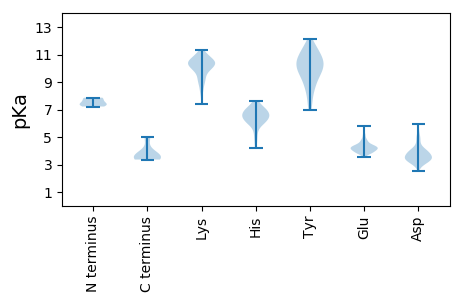
Summary statistics related to proteome-wise predictions


Protein with the lowest isoelectric point:
>tr|A0A0S2ZXH8|A0A0S2ZXH8_9VIRU Triple gene block protein 2 OS=Actinidia virus X OX=1331744 PE=4 SV=1
MM1 pKa = 7.22EE2 pKa = 5.77LEE4 pKa = 4.09YY5 pKa = 10.75LINLLDD11 pKa = 3.91FYY13 pKa = 11.47GFVRR17 pKa = 11.84SSRR20 pKa = 11.84SFSLPLVIHH29 pKa = 6.41GVAGCGKK36 pKa = 8.46STIISKK42 pKa = 9.36VSCAYY47 pKa = 9.17PKK49 pKa = 10.48LISASFSPQLIDD61 pKa = 3.61PDD63 pKa = 3.61SGRR66 pKa = 11.84RR67 pKa = 11.84QSVVDD72 pKa = 3.74GTTVDD77 pKa = 5.21LLDD80 pKa = 4.78EE81 pKa = 4.27YY82 pKa = 11.51LAGNNPIVRR91 pKa = 11.84LAKK94 pKa = 10.58FSDD97 pKa = 3.57PLQYY101 pKa = 10.9DD102 pKa = 3.8CQSPEE107 pKa = 3.97EE108 pKa = 3.82PHH110 pKa = 6.19YY111 pKa = 10.65RR112 pKa = 11.84ALHH115 pKa = 4.38SHH117 pKa = 6.82RR118 pKa = 11.84FCPATAQLLNKK129 pKa = 9.92IFGCHH134 pKa = 4.92ITSKK138 pKa = 10.65LNTSAVIRR146 pKa = 11.84FADD149 pKa = 3.96AFTEE153 pKa = 4.28DD154 pKa = 4.32PEE156 pKa = 4.64GQVITFEE163 pKa = 4.69PEE165 pKa = 3.78LEE167 pKa = 4.31SLLTAHH173 pKa = 7.49GCPTTPVADD182 pKa = 3.45LWGRR186 pKa = 11.84NIPYY190 pKa = 9.89VSVYY194 pKa = 9.37TSSIGYY200 pKa = 9.65ALEE203 pKa = 4.28NYY205 pKa = 9.83RR206 pKa = 11.84SSLFLALTRR215 pKa = 11.84HH216 pKa = 5.26QKK218 pKa = 9.76QLLIFDD224 pKa = 4.73LDD226 pKa = 3.44ARR228 pKa = 11.84ADD230 pKa = 3.78PTHH233 pKa = 6.37EE234 pKa = 4.08LL235 pKa = 3.66
MM1 pKa = 7.22EE2 pKa = 5.77LEE4 pKa = 4.09YY5 pKa = 10.75LINLLDD11 pKa = 3.91FYY13 pKa = 11.47GFVRR17 pKa = 11.84SSRR20 pKa = 11.84SFSLPLVIHH29 pKa = 6.41GVAGCGKK36 pKa = 8.46STIISKK42 pKa = 9.36VSCAYY47 pKa = 9.17PKK49 pKa = 10.48LISASFSPQLIDD61 pKa = 3.61PDD63 pKa = 3.61SGRR66 pKa = 11.84RR67 pKa = 11.84QSVVDD72 pKa = 3.74GTTVDD77 pKa = 5.21LLDD80 pKa = 4.78EE81 pKa = 4.27YY82 pKa = 11.51LAGNNPIVRR91 pKa = 11.84LAKK94 pKa = 10.58FSDD97 pKa = 3.57PLQYY101 pKa = 10.9DD102 pKa = 3.8CQSPEE107 pKa = 3.97EE108 pKa = 3.82PHH110 pKa = 6.19YY111 pKa = 10.65RR112 pKa = 11.84ALHH115 pKa = 4.38SHH117 pKa = 6.82RR118 pKa = 11.84FCPATAQLLNKK129 pKa = 9.92IFGCHH134 pKa = 4.92ITSKK138 pKa = 10.65LNTSAVIRR146 pKa = 11.84FADD149 pKa = 3.96AFTEE153 pKa = 4.28DD154 pKa = 4.32PEE156 pKa = 4.64GQVITFEE163 pKa = 4.69PEE165 pKa = 3.78LEE167 pKa = 4.31SLLTAHH173 pKa = 7.49GCPTTPVADD182 pKa = 3.45LWGRR186 pKa = 11.84NIPYY190 pKa = 9.89VSVYY194 pKa = 9.37TSSIGYY200 pKa = 9.65ALEE203 pKa = 4.28NYY205 pKa = 9.83RR206 pKa = 11.84SSLFLALTRR215 pKa = 11.84HH216 pKa = 5.26QKK218 pKa = 9.76QLLIFDD224 pKa = 4.73LDD226 pKa = 3.44ARR228 pKa = 11.84ADD230 pKa = 3.78PTHH233 pKa = 6.37EE234 pKa = 4.08LL235 pKa = 3.66
Molecular weight: 26.13 kDa
Isoelectric point according different methods:
Protein with the highest isoelectric point:
>tr|A0A0S2ZX53|A0A0S2ZX53_9VIRU Movement protein TGBp3 OS=Actinidia virus X OX=1331744 PE=3 SV=1
MM1 pKa = 7.32SHH3 pKa = 7.64PDD5 pKa = 3.03SSAATLLRR13 pKa = 11.84LSGTCALIPALRR25 pKa = 11.84PLTGSKK31 pKa = 8.24WVYY34 pKa = 10.25RR35 pKa = 11.84SLNALLALTSLRR47 pKa = 11.84PCSHH51 pKa = 6.46QLLLNLKK58 pKa = 9.11GDD60 pKa = 3.92SYY62 pKa = 12.15ANPLCGKK69 pKa = 9.73SKK71 pKa = 9.08PTLSQRR77 pKa = 11.84LAPWPVRR84 pKa = 11.84RR85 pKa = 11.84FRR87 pKa = 11.84MAITSPTT94 pKa = 3.36
MM1 pKa = 7.32SHH3 pKa = 7.64PDD5 pKa = 3.03SSAATLLRR13 pKa = 11.84LSGTCALIPALRR25 pKa = 11.84PLTGSKK31 pKa = 8.24WVYY34 pKa = 10.25RR35 pKa = 11.84SLNALLALTSLRR47 pKa = 11.84PCSHH51 pKa = 6.46QLLLNLKK58 pKa = 9.11GDD60 pKa = 3.92SYY62 pKa = 12.15ANPLCGKK69 pKa = 9.73SKK71 pKa = 9.08PTLSQRR77 pKa = 11.84LAPWPVRR84 pKa = 11.84RR85 pKa = 11.84FRR87 pKa = 11.84MAITSPTT94 pKa = 3.36
Molecular weight: 10.26 kDa
Isoelectric point according different methods:
Peptides (in silico digests for buttom-up proteomics)
Below you can find in silico digests of the whole proteome with Trypsin, Chymotrypsin, Trypsin+LysC, LysN, ArgC proteases suitable for different mass spec machines.| Try ESI |
 |
|---|
| ChTry ESI |
 |
|---|
| ArgC ESI |
 |
|---|
| LysN ESI |
 |
|---|
| TryLysC ESI |
 |
|---|
| Try MALDI |
 |
|---|
| ChTry MALDI |
 |
|---|
| ArgC MALDI |
 |
|---|
| LysN MALDI |
 |
|---|
| TryLysC MALDI |
 |
|---|
| Try LTQ |
 |
|---|
| ChTry LTQ |
 |
|---|
| ArgC LTQ |
 |
|---|
| LysN LTQ |
 |
|---|
| TryLysC LTQ |
 |
|---|
| Try MSlow |
 |
|---|
| ChTry MSlow |
 |
|---|
| ArgC MSlow |
 |
|---|
| LysN MSlow |
 |
|---|
| TryLysC MSlow |
 |
|---|
| Try MShigh |
 |
|---|
| ChTry MShigh |
 |
|---|
| ArgC MShigh |
 |
|---|
| LysN MShigh |
 |
|---|
| TryLysC MShigh |
 |
|---|
General Statistics
Number of major isoforms |
Number of additional isoforms |
Number of all proteins |
Number of amino acids |
Min. Seq. Length |
Max. Seq. Length |
Avg. Seq. Length |
Avg. Mol. Weight |
|---|---|---|---|---|---|---|---|
0 |
2376 |
89 |
1591 |
396.0 |
44.18 |
Amino acid frequency
Ala |
Cys |
Asp |
Glu |
Phe |
Gly |
His |
Ile |
Lys |
Leu |
|---|---|---|---|---|---|---|---|---|---|
8.923 ± 0.482 | 1.726 ± 0.377 |
4.924 ± 0.703 | 5.345 ± 1.077 |
3.956 ± 0.576 | 4.882 ± 0.968 |
3.535 ± 0.924 | 5.093 ± 0.395 |
4.882 ± 0.786 | 9.68 ± 1.037 |
Met |
Asn |
Gln |
Pro |
Arg |
Ser |
Thr |
Val |
Trp |
Tyr |
|---|---|---|---|---|---|---|---|---|---|
2.104 ± 0.448 | 3.998 ± 0.239 |
7.407 ± 0.789 | 4.209 ± 0.279 |
5.051 ± 0.333 | 6.439 ± 1.139 |
7.576 ± 0.445 | 5.766 ± 0.473 |
1.136 ± 0.167 | 3.367 ± 0.355 |
Most of the basic statistics you can see at this page can be downloaded from this CSV file
Proteome-pI is available under Creative Commons Attribution-NoDerivs license, for more details see here
| Reference: Kozlowski LP. Proteome-pI 2.0: Proteome Isoelectric Point Database Update. Nucleic Acids Res. 2021, doi: 10.1093/nar/gkab944 | Contact: Lukasz P. Kozlowski |
