Bacillus phage DK2
Taxonomy: Viruses; Duplodnaviria; Heunggongvirae; Uroviricota; Caudoviricetes; Caudovirales; Salasmaviridae; Northropvirinae; Hemphillvirus; Bacillus virus DK2
Average proteome isoelectric point is 6.27
Get precalculated fractions of proteins
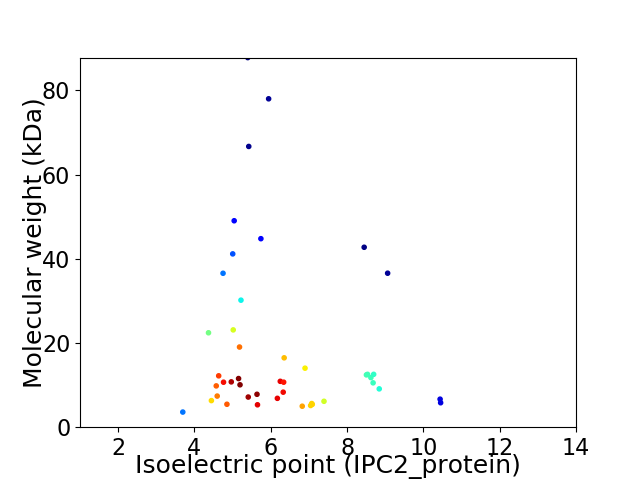
Virtual 2D-PAGE plot for 45 proteins (isoelectric point calculated using IPC2_protein)
Get csv file with sequences according to given criteria:
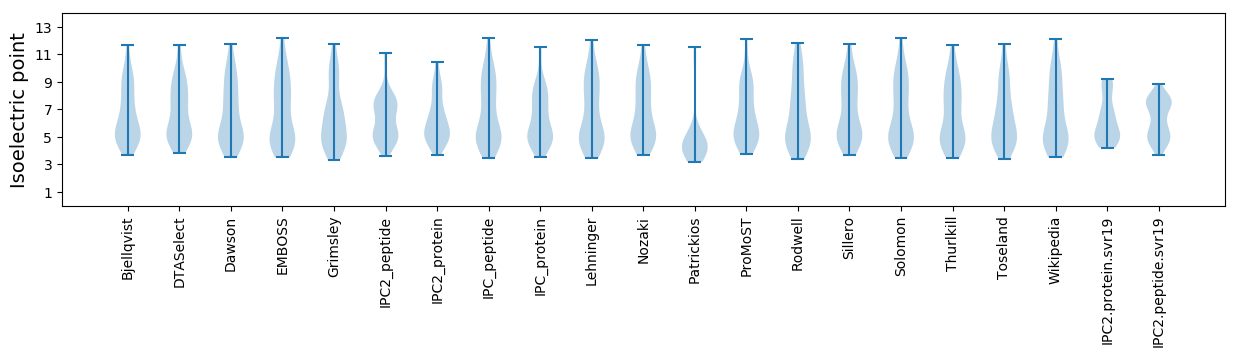
* You can choose from 21 different methods for calculating isoelectric point
Summary statistics related to proteome-wise predictions
Protein with the lowest isoelectric point:
>tr|A0A3T0IJ45|A0A3T0IJ45_9CAUD Tail protein OS=Bacillus phage DK2 OX=2500809 GN=DK2_000031 PE=4 SV=1
MM1 pKa = 7.4EE2 pKa = 5.56NEE4 pKa = 3.49LDD6 pKa = 4.74FYY8 pKa = 10.98IDD10 pKa = 3.61EE11 pKa = 4.72NGSKK15 pKa = 10.53VFILKK20 pKa = 10.3EE21 pKa = 3.86YY22 pKa = 10.6DD23 pKa = 3.6PQDD26 pKa = 3.84DD27 pKa = 4.13AEE29 pKa = 4.11QQ30 pKa = 3.7
MM1 pKa = 7.4EE2 pKa = 5.56NEE4 pKa = 3.49LDD6 pKa = 4.74FYY8 pKa = 10.98IDD10 pKa = 3.61EE11 pKa = 4.72NGSKK15 pKa = 10.53VFILKK20 pKa = 10.3EE21 pKa = 3.86YY22 pKa = 10.6DD23 pKa = 3.6PQDD26 pKa = 3.84DD27 pKa = 4.13AEE29 pKa = 4.11QQ30 pKa = 3.7
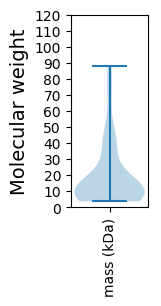
Molecular weight: 3.6 kDa
Isoelectric point according different methods:
Protein with the highest isoelectric point:
>tr|A0A3T0IIZ2|A0A3T0IIZ2_9CAUD Terminal protein OS=Bacillus phage DK2 OX=2500809 GN=DK2_000018 PE=4 SV=1
MM1 pKa = 7.67NINKK5 pKa = 8.24VFPLEE10 pKa = 3.9NKK12 pKa = 9.32FRR14 pKa = 11.84LRR16 pKa = 11.84KK17 pKa = 10.1GKK19 pKa = 8.59MLYY22 pKa = 9.98PRR24 pKa = 11.84TKK26 pKa = 10.2PLFKK30 pKa = 10.22RR31 pKa = 11.84YY32 pKa = 9.19LQIHH36 pKa = 4.98YY37 pKa = 10.06LIRR40 pKa = 11.84KK41 pKa = 8.41NSNPSNN47 pKa = 3.6
MM1 pKa = 7.67NINKK5 pKa = 8.24VFPLEE10 pKa = 3.9NKK12 pKa = 9.32FRR14 pKa = 11.84LRR16 pKa = 11.84KK17 pKa = 10.1GKK19 pKa = 8.59MLYY22 pKa = 9.98PRR24 pKa = 11.84TKK26 pKa = 10.2PLFKK30 pKa = 10.22RR31 pKa = 11.84YY32 pKa = 9.19LQIHH36 pKa = 4.98YY37 pKa = 10.06LIRR40 pKa = 11.84KK41 pKa = 8.41NSNPSNN47 pKa = 3.6
Molecular weight: 5.81 kDa
Isoelectric point according different methods:
Peptides (in silico digests for buttom-up proteomics)
Below you can find in silico digests of the whole proteome with Trypsin, Chymotrypsin, Trypsin+LysC, LysN, ArgC proteases suitable for different mass spec machines.| Try ESI |
 |
|---|
| ChTry ESI |
|
|---|
| ArgC ESI |
|
|---|
| LysN ESI |
|
|---|
| TryLysC ESI |
|
|---|
| Try MALDI |
|
|---|
| ChTry MALDI |
|
|---|
| ArgC MALDI |
|
|---|
| LysN MALDI |
|
|---|
| TryLysC MALDI |
|
|---|
| Try LTQ |
|
|---|
| ChTry LTQ |
|
|---|
| ArgC LTQ |
|
|---|
| LysN LTQ |
|
|---|
| TryLysC LTQ |
|
|---|
| Try MSlow |
|
|---|
| ChTry MSlow |
|
|---|
| ArgC MSlow |
|
|---|
| LysN MSlow |
|
|---|
| TryLysC MSlow |
|
|---|
| Try MShigh |
|
|---|
| ChTry MShigh |
|
|---|
| ArgC MShigh |
|
|---|
| LysN MShigh |
|
|---|
| TryLysC MShigh |
|
|---|
General Statistics
Number of major isoforms |
Number of additional isoforms |
Number of all proteins |
Number of amino acids |
Min. Seq. Length |
Max. Seq. Length |
Avg. Seq. Length |
Avg. Mol. Weight |
|---|---|---|---|---|---|---|---|
0 |
7453 |
30 |
778 |
165.6 |
19.16 |
Amino acid frequency
Ala |
Cys |
Asp |
Glu |
Phe |
Gly |
His |
Ile |
Lys |
Leu |
|---|---|---|---|---|---|---|---|---|---|
4.213 ± 0.417 | 1.127 ± 0.154 |
6.829 ± 0.304 | 7.943 ± 0.462 |
4.468 ± 0.267 | 6.333 ± 0.393 |
1.744 ± 0.154 | 7.017 ± 0.398 |
9.285 ± 0.533 | 7.178 ± 0.301 |
Met |
Asn |
Gln |
Pro |
Arg |
Ser |
Thr |
Val |
Trp |
Tyr |
|---|---|---|---|---|---|---|---|---|---|
3.421 ± 0.257 | 6.829 ± 0.401 |
2.603 ± 0.285 | 3.475 ± 0.223 |
4.32 ± 0.299 | 4.884 ± 0.204 |
5.796 ± 0.483 | 6.467 ± 0.366 |
1.315 ± 0.192 | 4.75 ± 0.216 |
Most of the basic statistics you can see at this page can be downloaded from this CSV file
See this proteome in:

Proteome-pI is available under Creative Commons Attribution-NoDerivs license, for more details see here
| Reference: Kozlowski LP. Proteome-pI 2.0: Proteome Isoelectric Point Database Update. Nucleic Acids Res. 2021, doi: 10.1093/nar/gkab944 | Contact: Lukasz P. Kozlowski |