Colletotrichum camelliae filamentous virus 1
Taxonomy: Viruses; unclassified viruses
Average proteome isoelectric point is 6.91
Get precalculated fractions of proteins

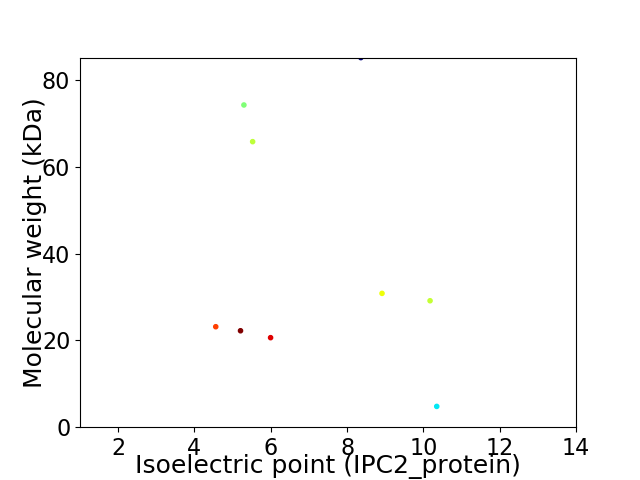
Virtual 2D-PAGE plot for 9 proteins (isoelectric point calculated using IPC2_protein)
Get csv file with sequences according to given criteria:
* You can choose from 21 different methods for calculating isoelectric point
Summary statistics related to proteome-wise predictions


Protein with the lowest isoelectric point:
>tr|A0A286M3N6|A0A286M3N6_9VIRU Uncharacterized protein OS=Colletotrichum camelliae filamentous virus 1 OX=2029458 PE=4 SV=1
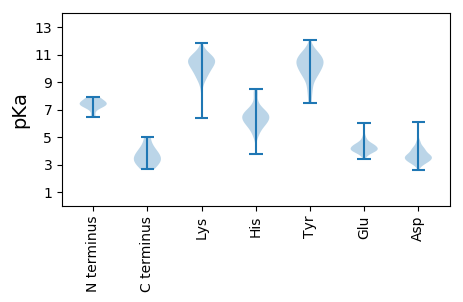
MM1 pKa = 7.33VNEE4 pKa = 4.54VISNAEE10 pKa = 4.01VGPGITMVRR19 pKa = 11.84LGRR22 pKa = 11.84DD23 pKa = 3.19DD24 pKa = 3.81MEE26 pKa = 4.52GVISDD31 pKa = 3.59FTRR34 pKa = 11.84THH36 pKa = 6.0ILDD39 pKa = 3.59PRR41 pKa = 11.84FSLSFCIAIYY51 pKa = 10.6NVIQYY56 pKa = 10.21PEE58 pKa = 4.61GYY60 pKa = 9.71EE61 pKa = 4.01VADD64 pKa = 4.03KK65 pKa = 11.17GNSFGRR71 pKa = 11.84IVIIADD77 pKa = 3.59YY78 pKa = 9.95EE79 pKa = 4.16WRR81 pKa = 11.84GLEE84 pKa = 3.76KK85 pKa = 10.76DD86 pKa = 3.56LAIGVWFPDD95 pKa = 3.3LKK97 pKa = 11.1AFCFVDD103 pKa = 3.54LHH105 pKa = 6.58PVLSDD110 pKa = 3.66PPNLRR115 pKa = 11.84PNCWVDD121 pKa = 3.22VLTGVAGQGVIVTALLGASARR142 pKa = 11.84LLQDD146 pKa = 3.75RR147 pKa = 11.84YY148 pKa = 10.15LHH150 pKa = 6.36KK151 pKa = 11.23SPDD154 pKa = 3.55KK155 pKa = 10.6FSCRR159 pKa = 11.84YY160 pKa = 9.6EE161 pKa = 4.69DD162 pKa = 4.06DD163 pKa = 3.75SKK165 pKa = 11.86LPGVQFAGRR174 pKa = 11.84NVEE177 pKa = 4.31YY178 pKa = 11.08NRR180 pKa = 11.84MAHH183 pKa = 6.32GLAVPTSADD192 pKa = 3.09EE193 pKa = 4.79GGSVLYY199 pKa = 9.89PDD201 pKa = 4.27YY202 pKa = 11.14DD203 pKa = 3.69SSEE206 pKa = 4.09EE207 pKa = 4.19SEE209 pKa = 4.18
MM1 pKa = 7.33VNEE4 pKa = 4.54VISNAEE10 pKa = 4.01VGPGITMVRR19 pKa = 11.84LGRR22 pKa = 11.84DD23 pKa = 3.19DD24 pKa = 3.81MEE26 pKa = 4.52GVISDD31 pKa = 3.59FTRR34 pKa = 11.84THH36 pKa = 6.0ILDD39 pKa = 3.59PRR41 pKa = 11.84FSLSFCIAIYY51 pKa = 10.6NVIQYY56 pKa = 10.21PEE58 pKa = 4.61GYY60 pKa = 9.71EE61 pKa = 4.01VADD64 pKa = 4.03KK65 pKa = 11.17GNSFGRR71 pKa = 11.84IVIIADD77 pKa = 3.59YY78 pKa = 9.95EE79 pKa = 4.16WRR81 pKa = 11.84GLEE84 pKa = 3.76KK85 pKa = 10.76DD86 pKa = 3.56LAIGVWFPDD95 pKa = 3.3LKK97 pKa = 11.1AFCFVDD103 pKa = 3.54LHH105 pKa = 6.58PVLSDD110 pKa = 3.66PPNLRR115 pKa = 11.84PNCWVDD121 pKa = 3.22VLTGVAGQGVIVTALLGASARR142 pKa = 11.84LLQDD146 pKa = 3.75RR147 pKa = 11.84YY148 pKa = 10.15LHH150 pKa = 6.36KK151 pKa = 11.23SPDD154 pKa = 3.55KK155 pKa = 10.6FSCRR159 pKa = 11.84YY160 pKa = 9.6EE161 pKa = 4.69DD162 pKa = 4.06DD163 pKa = 3.75SKK165 pKa = 11.86LPGVQFAGRR174 pKa = 11.84NVEE177 pKa = 4.31YY178 pKa = 11.08NRR180 pKa = 11.84MAHH183 pKa = 6.32GLAVPTSADD192 pKa = 3.09EE193 pKa = 4.79GGSVLYY199 pKa = 9.89PDD201 pKa = 4.27YY202 pKa = 11.14DD203 pKa = 3.69SSEE206 pKa = 4.09EE207 pKa = 4.19SEE209 pKa = 4.18
Molecular weight: 23.15 kDa
Isoelectric point according different methods:
Protein with the highest isoelectric point:
>tr|A0A286M3N4|A0A286M3N4_9VIRU Uncharacterized protein OS=Colletotrichum camelliae filamentous virus 1 OX=2029458 PE=4 SV=1
MM1 pKa = 7.88PFFSHH6 pKa = 6.94RR7 pKa = 11.84RR8 pKa = 11.84FLFFFSAVVIGPDD21 pKa = 3.07RR22 pKa = 11.84SNPRR26 pKa = 11.84APRR29 pKa = 11.84RR30 pKa = 11.84GWWNVPRR37 pKa = 11.84DD38 pKa = 3.7AVV40 pKa = 3.35
MM1 pKa = 7.88PFFSHH6 pKa = 6.94RR7 pKa = 11.84RR8 pKa = 11.84FLFFFSAVVIGPDD21 pKa = 3.07RR22 pKa = 11.84SNPRR26 pKa = 11.84APRR29 pKa = 11.84RR30 pKa = 11.84GWWNVPRR37 pKa = 11.84DD38 pKa = 3.7AVV40 pKa = 3.35
Molecular weight: 4.79 kDa
Isoelectric point according different methods:
Peptides (in silico digests for buttom-up proteomics)
Below you can find in silico digests of the whole proteome with Trypsin, Chymotrypsin, Trypsin+LysC, LysN, ArgC proteases suitable for different mass spec machines.| Try ESI |
 |
|---|
| ChTry ESI |
 |
|---|
| ArgC ESI |
 |
|---|
| LysN ESI |
 |
|---|
| TryLysC ESI |
 |
|---|
| Try MALDI |
 |
|---|
| ChTry MALDI |
 |
|---|
| ArgC MALDI |
 |
|---|
| LysN MALDI |
 |
|---|
| TryLysC MALDI |
 |
|---|
| Try LTQ |
 |
|---|
| ChTry LTQ |
 |
|---|
| ArgC LTQ |
 |
|---|
| LysN LTQ |
 |
|---|
| TryLysC LTQ |
 |
|---|
| Try MSlow |
 |
|---|
| ChTry MSlow |
 |
|---|
| ArgC MSlow |
 |
|---|
| LysN MSlow |
 |
|---|
| TryLysC MSlow |
 |
|---|
| Try MShigh |
 |
|---|
| ChTry MShigh |
 |
|---|
| ArgC MShigh |
 |
|---|
| LysN MShigh |
 |
|---|
| TryLysC MShigh |
 |
|---|
General Statistics
Number of major isoforms |
Number of additional isoforms |
Number of all proteins |
Number of amino acids |
Min. Seq. Length |
Max. Seq. Length |
Avg. Seq. Length |
Avg. Mol. Weight |
|---|---|---|---|---|---|---|---|
0 |
3289 |
40 |
771 |
365.4 |
39.55 |
Amino acid frequency
Ala |
Cys |
Asp |
Glu |
Phe |
Gly |
His |
Ile |
Lys |
Leu |
|---|---|---|---|---|---|---|---|---|---|
10.125 ± 0.764 | 1.459 ± 0.26 |
6.841 ± 0.508 | 4.439 ± 0.37 |
3.588 ± 0.388 | 7.936 ± 0.572 |
1.976 ± 0.244 | 2.615 ± 0.351 |
2.615 ± 0.448 | 8.392 ± 0.703 |
Met |
Asn |
Gln |
Pro |
Arg |
Ser |
Thr |
Val |
Trp |
Tyr |
|---|---|---|---|---|---|---|---|---|---|
2.524 ± 0.277 | 2.463 ± 0.194 |
6.719 ± 0.518 | 1.763 ± 0.252 |
8.696 ± 0.642 | 8.878 ± 0.91 |
5.412 ± 0.386 | 10.125 ± 0.632 |
0.912 ± 0.159 | 2.524 ± 0.33 |
Most of the basic statistics you can see at this page can be downloaded from this CSV file
Proteome-pI is available under Creative Commons Attribution-NoDerivs license, for more details see here
| Reference: Kozlowski LP. Proteome-pI 2.0: Proteome Isoelectric Point Database Update. Nucleic Acids Res. 2021, doi: 10.1093/nar/gkab944 | Contact: Lukasz P. Kozlowski |
