Flavobacterium phage FCV-16
Taxonomy: Viruses; Duplodnaviria; Heunggongvirae; Uroviricota; Caudoviricetes; Caudovirales; Myoviridae; Ficleduovirus; unclassified Ficleduovirus
Average proteome isoelectric point is 6.76
Get precalculated fractions of proteins
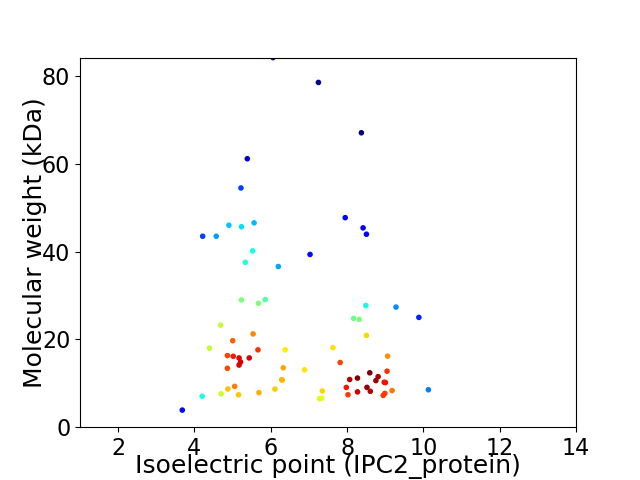
Virtual 2D-PAGE plot for 74 proteins (isoelectric point calculated using IPC2_protein)
Get csv file with sequences according to given criteria:
* You can choose from 21 different methods for calculating isoelectric point
Summary statistics related to proteome-wise predictions


Protein with the lowest isoelectric point:
>tr|A0A218M6R9|A0A218M6R9_9CAUD Uncharacterized protein OS=Flavobacterium phage FCV-16 OX=1984748 PE=4 SV=1
MM1 pKa = 8.28LEE3 pKa = 3.85IFFTINGIDD12 pKa = 3.38QKK14 pKa = 10.67EE15 pKa = 3.91IAVFYY20 pKa = 10.96DD21 pKa = 3.81NEE23 pKa = 4.04DD24 pKa = 2.72LKK26 pKa = 11.6YY27 pKa = 10.41FVEE30 pKa = 4.98TYY32 pKa = 10.32KK33 pKa = 10.93EE34 pKa = 4.05QVLEE38 pKa = 4.09QYY40 pKa = 7.58PTATNIRR47 pKa = 11.84LGDD50 pKa = 3.94LSTSLNNYY58 pKa = 7.79NAA60 pKa = 4.02
MM1 pKa = 8.28LEE3 pKa = 3.85IFFTINGIDD12 pKa = 3.38QKK14 pKa = 10.67EE15 pKa = 3.91IAVFYY20 pKa = 10.96DD21 pKa = 3.81NEE23 pKa = 4.04DD24 pKa = 2.72LKK26 pKa = 11.6YY27 pKa = 10.41FVEE30 pKa = 4.98TYY32 pKa = 10.32KK33 pKa = 10.93EE34 pKa = 4.05QVLEE38 pKa = 4.09QYY40 pKa = 7.58PTATNIRR47 pKa = 11.84LGDD50 pKa = 3.94LSTSLNNYY58 pKa = 7.79NAA60 pKa = 4.02
Molecular weight: 7.04 kDa
Isoelectric point according different methods:
Protein with the highest isoelectric point:
>tr|A0A218M6G8|A0A218M6G8_9CAUD ParB domain-containing protein OS=Flavobacterium phage FCV-16 OX=1984748 PE=4 SV=1
MM1 pKa = 7.56RR2 pKa = 11.84AWNANLRR9 pKa = 11.84LKK11 pKa = 10.72ANRR14 pKa = 11.84VVYY17 pKa = 10.17RR18 pKa = 11.84AYY20 pKa = 8.46THH22 pKa = 6.43NMVKK26 pKa = 8.85PTGTTDD32 pKa = 3.4YY33 pKa = 10.89VSVSFVLPVKK43 pKa = 10.66SDD45 pKa = 3.41FLANGGLLYY54 pKa = 10.87VNPNTGITITNRR66 pKa = 11.84YY67 pKa = 7.56IAAGLLHH74 pKa = 6.79KK75 pKa = 10.68GVV77 pKa = 3.71
MM1 pKa = 7.56RR2 pKa = 11.84AWNANLRR9 pKa = 11.84LKK11 pKa = 10.72ANRR14 pKa = 11.84VVYY17 pKa = 10.17RR18 pKa = 11.84AYY20 pKa = 8.46THH22 pKa = 6.43NMVKK26 pKa = 8.85PTGTTDD32 pKa = 3.4YY33 pKa = 10.89VSVSFVLPVKK43 pKa = 10.66SDD45 pKa = 3.41FLANGGLLYY54 pKa = 10.87VNPNTGITITNRR66 pKa = 11.84YY67 pKa = 7.56IAAGLLHH74 pKa = 6.79KK75 pKa = 10.68GVV77 pKa = 3.71
Molecular weight: 8.52 kDa
Isoelectric point according different methods:
Peptides (in silico digests for buttom-up proteomics)
Below you can find in silico digests of the whole proteome with Trypsin, Chymotrypsin, Trypsin+LysC, LysN, ArgC proteases suitable for different mass spec machines.| Try ESI |
 |
|---|
| ChTry ESI |
|
|---|
| ArgC ESI |
|
|---|
| LysN ESI |
|
|---|
| TryLysC ESI |
|
|---|
| Try MALDI |
|
|---|
| ChTry MALDI |
|
|---|
| ArgC MALDI |
|
|---|
| LysN MALDI |
|
|---|
| TryLysC MALDI |
|
|---|
| Try LTQ |
|
|---|
| ChTry LTQ |
|
|---|
| ArgC LTQ |
|
|---|
| LysN LTQ |
|
|---|
| TryLysC LTQ |
|
|---|
| Try MSlow |
|
|---|
| ChTry MSlow |
|
|---|
| ArgC MSlow |
|
|---|
| LysN MSlow |
|
|---|
| TryLysC MSlow |
|
|---|
| Try MShigh |
|
|---|
| ChTry MShigh |
|
|---|
| ArgC MShigh |
|
|---|
| LysN MShigh |
|
|---|
| TryLysC MShigh |
|
|---|
General Statistics
Number of major isoforms |
Number of additional isoforms |
Number of all proteins |
Number of amino acids |
Min. Seq. Length |
Max. Seq. Length |
Avg. Seq. Length |
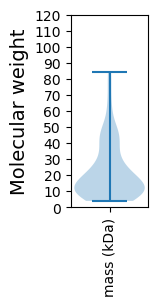
Avg. Mol. Weight |
|---|---|---|---|---|---|---|---|
0 |
14557 |
34 |
729 |
196.7 |
22.48 |
Amino acid frequency
Ala |
Cys |
Asp |
Glu |
Phe |
Gly |
His |
Ile |
Lys |
Leu |
|---|---|---|---|---|---|---|---|---|---|
5.132 ± 0.421 | 0.934 ± 0.124 |
5.75 ± 0.207 | 7.055 ± 0.455 |
4.788 ± 0.214 | 5.489 ± 0.301 |
1.285 ± 0.123 | 7.866 ± 0.26 |
9.48 ± 0.421 | 9.006 ± 0.262 |
Met |
Asn |
Gln |
Pro |
Arg |
Ser |
Thr |
Val |
Trp |
Tyr |
|---|---|---|---|---|---|---|---|---|---|
2.164 ± 0.146 | 7.309 ± 0.303 |
2.885 ± 0.161 | 3.661 ± 0.181 |
3.483 ± 0.197 | 6.595 ± 0.261 |
5.873 ± 0.252 | 5.832 ± 0.204 |
1.085 ± 0.115 | 4.328 ± 0.26 |
Most of the basic statistics you can see at this page can be downloaded from this CSV file
See this proteome in:

Proteome-pI is available under Creative Commons Attribution-NoDerivs license, for more details see here
| Reference: Kozlowski LP. Proteome-pI 2.0: Proteome Isoelectric Point Database Update. Nucleic Acids Res. 2021, doi: 10.1093/nar/gkab944 | Contact: Lukasz P. Kozlowski |