Denitrobacterium detoxificans
Taxonomy: cellular organisms; Bacteria; Terrabacteria group; Actinobacteria; Coriobacteriia; Eggerthellales; Eggerthellaceae; Denitrobacterium
Average proteome isoelectric point is 5.66
Get precalculated fractions of proteins

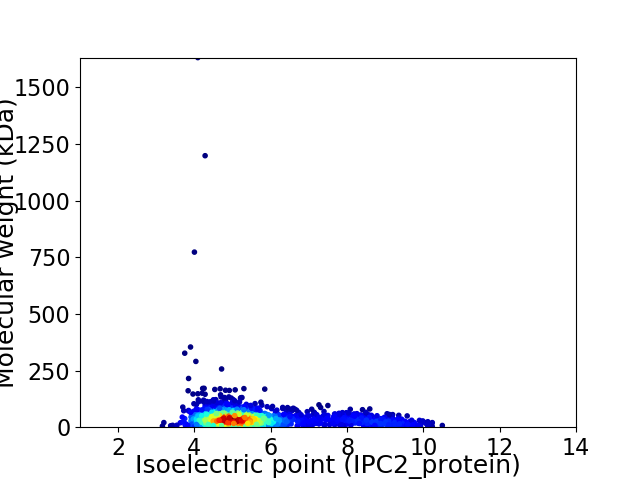
Virtual 2D-PAGE plot for 1932 proteins (isoelectric point calculated using IPC2_protein)
Get csv file with sequences according to given criteria:
* You can choose from 21 different methods for calculating isoelectric point
Summary statistics related to proteome-wise predictions


Protein with the lowest isoelectric point:
>tr|A0A1H8R313|A0A1H8R313_9ACTN Uncharacterized protein OS=Denitrobacterium detoxificans OX=79604 GN=SAMN02910314_00636 PE=4 SV=1
MM1 pKa = 7.7PSLEE5 pKa = 4.39RR6 pKa = 11.84GMNMICPKK14 pKa = 10.4CGASQLEE21 pKa = 4.37GTKK24 pKa = 10.16FCTSCGSEE32 pKa = 4.39LSGADD37 pKa = 3.03AAQPTVAQPAAPAQPAVAPTQPVAAPTQPVTGTVPPAGYY76 pKa = 6.61TQPGTAPASQPSNGKK91 pKa = 7.95VTGAFVRR98 pKa = 11.84GILSIIFALFMPIVGLILGIVAIAIGSSAYY128 pKa = 10.39RR129 pKa = 11.84EE130 pKa = 4.33TQEE133 pKa = 5.06SRR135 pKa = 11.84AKK137 pKa = 9.44TGKK140 pKa = 7.5TCGIVGLVISVLWIVIAIIFSATIFSATILAMVSSADD177 pKa = 3.55PSLLNSNGGSSINTPATPSTPSSDD201 pKa = 4.11DD202 pKa = 3.06EE203 pKa = 4.37AAAMASVQSYY213 pKa = 11.3LDD215 pKa = 3.64TNLTFSDD222 pKa = 4.32SEE224 pKa = 4.15ISTLASEE231 pKa = 4.55IDD233 pKa = 3.61SSFSSSTGFGLSQIGVDD250 pKa = 3.53PNQFAKK256 pKa = 10.19WLVGDD261 pKa = 4.42LSGTATSATVEE272 pKa = 4.33DD273 pKa = 4.56GEE275 pKa = 4.78GTVTCSITTRR285 pKa = 11.84DD286 pKa = 3.24FDD288 pKa = 4.24YY289 pKa = 11.35FMTDD293 pKa = 3.37FQTSVNNLDD302 pKa = 3.52YY303 pKa = 11.51SSFSDD308 pKa = 3.44MDD310 pKa = 3.6SAYY313 pKa = 10.41QAIGALMLQSMDD325 pKa = 3.28STPVVTRR332 pKa = 11.84TLDD335 pKa = 3.13IDD337 pKa = 3.83VEE339 pKa = 4.45NNLGDD344 pKa = 3.54WDD346 pKa = 3.84IEE348 pKa = 4.49YY349 pKa = 8.5PALTASDD356 pKa = 4.56LSDD359 pKa = 4.94LIYY362 pKa = 11.15GGMNLL367 pKa = 4.49
MM1 pKa = 7.7PSLEE5 pKa = 4.39RR6 pKa = 11.84GMNMICPKK14 pKa = 10.4CGASQLEE21 pKa = 4.37GTKK24 pKa = 10.16FCTSCGSEE32 pKa = 4.39LSGADD37 pKa = 3.03AAQPTVAQPAAPAQPAVAPTQPVAAPTQPVTGTVPPAGYY76 pKa = 6.61TQPGTAPASQPSNGKK91 pKa = 7.95VTGAFVRR98 pKa = 11.84GILSIIFALFMPIVGLILGIVAIAIGSSAYY128 pKa = 10.39RR129 pKa = 11.84EE130 pKa = 4.33TQEE133 pKa = 5.06SRR135 pKa = 11.84AKK137 pKa = 9.44TGKK140 pKa = 7.5TCGIVGLVISVLWIVIAIIFSATIFSATILAMVSSADD177 pKa = 3.55PSLLNSNGGSSINTPATPSTPSSDD201 pKa = 4.11DD202 pKa = 3.06EE203 pKa = 4.37AAAMASVQSYY213 pKa = 11.3LDD215 pKa = 3.64TNLTFSDD222 pKa = 4.32SEE224 pKa = 4.15ISTLASEE231 pKa = 4.55IDD233 pKa = 3.61SSFSSSTGFGLSQIGVDD250 pKa = 3.53PNQFAKK256 pKa = 10.19WLVGDD261 pKa = 4.42LSGTATSATVEE272 pKa = 4.33DD273 pKa = 4.56GEE275 pKa = 4.78GTVTCSITTRR285 pKa = 11.84DD286 pKa = 3.24FDD288 pKa = 4.24YY289 pKa = 11.35FMTDD293 pKa = 3.37FQTSVNNLDD302 pKa = 3.52YY303 pKa = 11.51SSFSDD308 pKa = 3.44MDD310 pKa = 3.6SAYY313 pKa = 10.41QAIGALMLQSMDD325 pKa = 3.28STPVVTRR332 pKa = 11.84TLDD335 pKa = 3.13IDD337 pKa = 3.83VEE339 pKa = 4.45NNLGDD344 pKa = 3.54WDD346 pKa = 3.84IEE348 pKa = 4.49YY349 pKa = 8.5PALTASDD356 pKa = 4.56LSDD359 pKa = 4.94LIYY362 pKa = 11.15GGMNLL367 pKa = 4.49
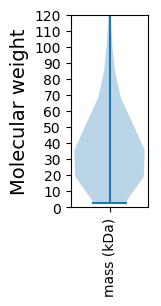
Molecular weight: 37.9 kDa
Isoelectric point according different methods:
Protein with the highest isoelectric point:
>tr|A0A1H8TPG9|A0A1H8TPG9_9ACTN Phage uncharacterized protein (Phage_XkdX) OS=Denitrobacterium detoxificans OX=79604 GN=SAMN02910314_01651 PE=4 SV=1
MM1 pKa = 7.91KK2 pKa = 10.51SLLLLALGLARR13 pKa = 11.84TVVLGARR20 pKa = 11.84IEE22 pKa = 4.02AEE24 pKa = 3.85RR25 pKa = 11.84IVVSVRR31 pKa = 11.84PYY33 pKa = 9.83KK34 pKa = 10.34RR35 pKa = 11.84EE36 pKa = 3.63QRR38 pKa = 11.84RR39 pKa = 11.84CPVCGRR45 pKa = 11.84ACDD48 pKa = 4.34FYY50 pKa = 12.06DD51 pKa = 3.32MANRR55 pKa = 11.84GAPRR59 pKa = 11.84LWW61 pKa = 4.65
MM1 pKa = 7.91KK2 pKa = 10.51SLLLLALGLARR13 pKa = 11.84TVVLGARR20 pKa = 11.84IEE22 pKa = 4.02AEE24 pKa = 3.85RR25 pKa = 11.84IVVSVRR31 pKa = 11.84PYY33 pKa = 9.83KK34 pKa = 10.34RR35 pKa = 11.84EE36 pKa = 3.63QRR38 pKa = 11.84RR39 pKa = 11.84CPVCGRR45 pKa = 11.84ACDD48 pKa = 4.34FYY50 pKa = 12.06DD51 pKa = 3.32MANRR55 pKa = 11.84GAPRR59 pKa = 11.84LWW61 pKa = 4.65
Molecular weight: 6.95 kDa
Isoelectric point according different methods:
Peptides (in silico digests for buttom-up proteomics)
Below you can find in silico digests of the whole proteome with Trypsin, Chymotrypsin, Trypsin+LysC, LysN, ArgC proteases suitable for different mass spec machines.| Try ESI |
 |
|---|
| ChTry ESI |
 |
|---|
| ArgC ESI |
 |
|---|
| LysN ESI |
 |
|---|
| TryLysC ESI |
 |
|---|
| Try MALDI |
 |
|---|
| ChTry MALDI |
 |
|---|
| ArgC MALDI |
 |
|---|
| LysN MALDI |
 |
|---|
| TryLysC MALDI |
 |
|---|
| Try LTQ |
 |
|---|
| ChTry LTQ |
 |
|---|
| ArgC LTQ |
 |
|---|
| LysN LTQ |
 |
|---|
| TryLysC LTQ |
 |
|---|
| Try MSlow |
 |
|---|
| ChTry MSlow |
 |
|---|
| ArgC MSlow |
 |
|---|
| LysN MSlow |
 |
|---|
| TryLysC MSlow |
 |
|---|
| Try MShigh |
 |
|---|
| ChTry MShigh |
 |
|---|
| ArgC MShigh |
 |
|---|
| LysN MShigh |
 |
|---|
| TryLysC MShigh |
 |
|---|
General Statistics
Number of major isoforms |
Number of additional isoforms |
Number of all proteins |
Number of amino acids |
Min. Seq. Length |
Max. Seq. Length |
Avg. Seq. Length |
Avg. Mol. Weight |
|---|---|---|---|---|---|---|---|
0 |
715596 |
22 |
15195 |
370.4 |
40.29 |
Amino acid frequency
Ala |
Cys |
Asp |
Glu |
Phe |
Gly |
His |
Ile |
Lys |
Leu |
|---|---|---|---|---|---|---|---|---|---|
11.151 ± 0.073 | 1.61 ± 0.044 |
5.912 ± 0.06 | 6.403 ± 0.098 |
3.755 ± 0.04 | 8.134 ± 0.073 |
1.889 ± 0.031 | 5.291 ± 0.069 |
3.623 ± 0.051 | 8.647 ± 0.095 |
Met |
Asn |
Gln |
Pro |
Arg |
Ser |
Thr |
Val |
Trp |
Tyr |
|---|---|---|---|---|---|---|---|---|---|
2.725 ± 0.038 | 3.378 ± 0.073 |
4.134 ± 0.039 | 3.201 ± 0.045 |
5.288 ± 0.103 | 6.513 ± 0.072 |
5.897 ± 0.205 | 7.981 ± 0.053 |
1.172 ± 0.046 | 3.295 ± 0.083 |
Most of the basic statistics you can see at this page can be downloaded from this CSV file
Proteome-pI is available under Creative Commons Attribution-NoDerivs license, for more details see here
| Reference: Kozlowski LP. Proteome-pI 2.0: Proteome Isoelectric Point Database Update. Nucleic Acids Res. 2021, doi: 10.1093/nar/gkab944 | Contact: Lukasz P. Kozlowski |
