Bacteroidales bacterium WCE2004
Taxonomy: cellular organisms; Bacteria; FCB group; Bacteroidetes/Chlorobi group; Bacteroidetes; Bacteroidia; Bacteroidales; unclassified Bacteroidales
Average proteome isoelectric point is 6.14
Get precalculated fractions of proteins

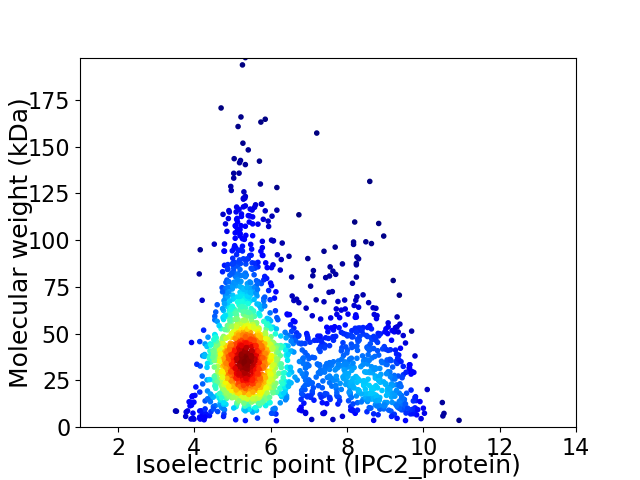
Virtual 2D-PAGE plot for 1930 proteins (isoelectric point calculated using IPC2_protein)
Get csv file with sequences according to given criteria:
* You can choose from 21 different methods for calculating isoelectric point
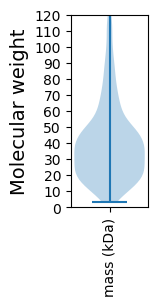
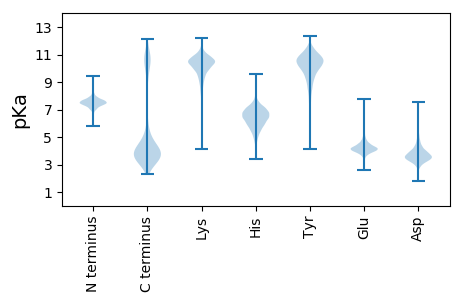
Summary statistics related to proteome-wise predictions


Protein with the lowest isoelectric point:
>tr|A0A1T5JNY1|A0A1T5JNY1_9BACT 1-deoxy-D-xylulose 5-phosphate reductoisomerase OS=Bacteroidales bacterium WCE2004 OX=1945890 GN=dxr PE=3 SV=1
MM1 pKa = 7.42MKK3 pKa = 10.18TMDD6 pKa = 5.06HH7 pKa = 6.9IIGMAALALTAATLLACSDD26 pKa = 3.59KK27 pKa = 11.29DD28 pKa = 3.62ALTSAQQPRR37 pKa = 11.84TYY39 pKa = 10.66TLTTTLSPKK48 pKa = 10.5GGVEE52 pKa = 4.3TRR54 pKa = 11.84SSMTDD59 pKa = 2.94NGDD62 pKa = 3.43GSISAAWEE70 pKa = 3.82VGDD73 pKa = 4.7QIWVLYY79 pKa = 8.99TNIGDD84 pKa = 3.84ASEE87 pKa = 4.06EE88 pKa = 4.06TMATVTAVDD97 pKa = 4.46PSTKK101 pKa = 10.35AATISLTLTNPKK113 pKa = 10.21NGGSISFGYY122 pKa = 9.24PAGFFNDD129 pKa = 3.95PKK131 pKa = 10.64DD132 pKa = 3.4PCIAQTGTLDD142 pKa = 5.13DD143 pKa = 4.06INANFAAISGTEE155 pKa = 3.88TMFVFDD161 pKa = 5.6SEE163 pKa = 4.58VTLPDD168 pKa = 3.48VTMMPAMCIWKK179 pKa = 10.12FSFTDD184 pKa = 3.61GTDD187 pKa = 4.24DD188 pKa = 3.19ITSAVTKK195 pKa = 10.28LVVNFPANSMTYY207 pKa = 10.5AVTPTSLDD215 pKa = 3.51NIYY218 pKa = 10.74VAMYY222 pKa = 10.58GDD224 pKa = 5.01IINGQPVSVIAQTDD238 pKa = 3.42LGVYY242 pKa = 9.75RR243 pKa = 11.84KK244 pKa = 7.36TAASVTLASGTTYY257 pKa = 10.66TSTGLEE263 pKa = 4.17LTSAAITNAVADD275 pKa = 5.32DD276 pKa = 3.4IGQLVGADD284 pKa = 3.33GNIYY288 pKa = 10.14PNADD292 pKa = 2.78IATAFGTSGVAMIGYY307 pKa = 9.81VGDD310 pKa = 4.41EE311 pKa = 4.25SDD313 pKa = 3.82CTHH316 pKa = 6.18GVAVALDD323 pKa = 3.98DD324 pKa = 4.44EE325 pKa = 4.55NGKK328 pKa = 10.61AKK330 pKa = 10.02MEE332 pKa = 4.31LSAATAACAAKK343 pKa = 10.49DD344 pKa = 3.8AVPDD348 pKa = 4.07GTWRR352 pKa = 11.84LPSRR356 pKa = 11.84KK357 pKa = 9.04DD358 pKa = 3.06WQYY361 pKa = 11.94LFIGCGSSWTYY372 pKa = 10.25TDD374 pKa = 4.24SPSGSIDD381 pKa = 3.45CSGLQSALDD390 pKa = 3.68AAGGILMSDD399 pKa = 3.88RR400 pKa = 11.84YY401 pKa = 10.03ICEE404 pKa = 3.39EE405 pKa = 3.88GARR408 pKa = 11.84VDD410 pKa = 4.19FTEE413 pKa = 4.69TSASFGFTSNPWYY426 pKa = 10.43VRR428 pKa = 11.84AVLAFF433 pKa = 4.01
MM1 pKa = 7.42MKK3 pKa = 10.18TMDD6 pKa = 5.06HH7 pKa = 6.9IIGMAALALTAATLLACSDD26 pKa = 3.59KK27 pKa = 11.29DD28 pKa = 3.62ALTSAQQPRR37 pKa = 11.84TYY39 pKa = 10.66TLTTTLSPKK48 pKa = 10.5GGVEE52 pKa = 4.3TRR54 pKa = 11.84SSMTDD59 pKa = 2.94NGDD62 pKa = 3.43GSISAAWEE70 pKa = 3.82VGDD73 pKa = 4.7QIWVLYY79 pKa = 8.99TNIGDD84 pKa = 3.84ASEE87 pKa = 4.06EE88 pKa = 4.06TMATVTAVDD97 pKa = 4.46PSTKK101 pKa = 10.35AATISLTLTNPKK113 pKa = 10.21NGGSISFGYY122 pKa = 9.24PAGFFNDD129 pKa = 3.95PKK131 pKa = 10.64DD132 pKa = 3.4PCIAQTGTLDD142 pKa = 5.13DD143 pKa = 4.06INANFAAISGTEE155 pKa = 3.88TMFVFDD161 pKa = 5.6SEE163 pKa = 4.58VTLPDD168 pKa = 3.48VTMMPAMCIWKK179 pKa = 10.12FSFTDD184 pKa = 3.61GTDD187 pKa = 4.24DD188 pKa = 3.19ITSAVTKK195 pKa = 10.28LVVNFPANSMTYY207 pKa = 10.5AVTPTSLDD215 pKa = 3.51NIYY218 pKa = 10.74VAMYY222 pKa = 10.58GDD224 pKa = 5.01IINGQPVSVIAQTDD238 pKa = 3.42LGVYY242 pKa = 9.75RR243 pKa = 11.84KK244 pKa = 7.36TAASVTLASGTTYY257 pKa = 10.66TSTGLEE263 pKa = 4.17LTSAAITNAVADD275 pKa = 5.32DD276 pKa = 3.4IGQLVGADD284 pKa = 3.33GNIYY288 pKa = 10.14PNADD292 pKa = 2.78IATAFGTSGVAMIGYY307 pKa = 9.81VGDD310 pKa = 4.41EE311 pKa = 4.25SDD313 pKa = 3.82CTHH316 pKa = 6.18GVAVALDD323 pKa = 3.98DD324 pKa = 4.44EE325 pKa = 4.55NGKK328 pKa = 10.61AKK330 pKa = 10.02MEE332 pKa = 4.31LSAATAACAAKK343 pKa = 10.49DD344 pKa = 3.8AVPDD348 pKa = 4.07GTWRR352 pKa = 11.84LPSRR356 pKa = 11.84KK357 pKa = 9.04DD358 pKa = 3.06WQYY361 pKa = 11.94LFIGCGSSWTYY372 pKa = 10.25TDD374 pKa = 4.24SPSGSIDD381 pKa = 3.45CSGLQSALDD390 pKa = 3.68AAGGILMSDD399 pKa = 3.88RR400 pKa = 11.84YY401 pKa = 10.03ICEE404 pKa = 3.39EE405 pKa = 3.88GARR408 pKa = 11.84VDD410 pKa = 4.19FTEE413 pKa = 4.69TSASFGFTSNPWYY426 pKa = 10.43VRR428 pKa = 11.84AVLAFF433 pKa = 4.01
Molecular weight: 45.29 kDa
Isoelectric point according different methods:
Protein with the highest isoelectric point:
>tr|A0A1T5ISF5|A0A1T5ISF5_9BACT Threonine/homoserine/homoserine lactone efflux protein OS=Bacteroidales bacterium WCE2004 OX=1945890 GN=SAMN06298214_0510 PE=4 SV=1
MM1 pKa = 7.84PNGKK5 pKa = 8.55KK6 pKa = 9.72HH7 pKa = 6.1KK8 pKa = 7.52RR9 pKa = 11.84HH10 pKa = 5.93KK11 pKa = 9.95MATHH15 pKa = 6.02KK16 pKa = 10.29RR17 pKa = 11.84KK18 pKa = 9.83KK19 pKa = 9.33RR20 pKa = 11.84LRR22 pKa = 11.84LNRR25 pKa = 11.84HH26 pKa = 5.05KK27 pKa = 10.84KK28 pKa = 9.26KK29 pKa = 10.89
MM1 pKa = 7.84PNGKK5 pKa = 8.55KK6 pKa = 9.72HH7 pKa = 6.1KK8 pKa = 7.52RR9 pKa = 11.84HH10 pKa = 5.93KK11 pKa = 9.95MATHH15 pKa = 6.02KK16 pKa = 10.29RR17 pKa = 11.84KK18 pKa = 9.83KK19 pKa = 9.33RR20 pKa = 11.84LRR22 pKa = 11.84LNRR25 pKa = 11.84HH26 pKa = 5.05KK27 pKa = 10.84KK28 pKa = 9.26KK29 pKa = 10.89
Molecular weight: 3.67 kDa
Isoelectric point according different methods:
Peptides (in silico digests for buttom-up proteomics)
Below you can find in silico digests of the whole proteome with Trypsin, Chymotrypsin, Trypsin+LysC, LysN, ArgC proteases suitable for different mass spec machines.| Try ESI |
 |
|---|
| ChTry ESI |
 |
|---|
| ArgC ESI |
 |
|---|
| LysN ESI |
 |
|---|
| TryLysC ESI |
 |
|---|
| Try MALDI |
 |
|---|
| ChTry MALDI |
 |
|---|
| ArgC MALDI |
 |
|---|
| LysN MALDI |
 |
|---|
| TryLysC MALDI |
 |
|---|
| Try LTQ |
 |
|---|
| ChTry LTQ |
 |
|---|
| ArgC LTQ |
 |
|---|
| LysN LTQ |
 |
|---|
| TryLysC LTQ |
 |
|---|
| Try MSlow |
 |
|---|
| ChTry MSlow |
 |
|---|
| ArgC MSlow |
 |
|---|
| LysN MSlow |
 |
|---|
| TryLysC MSlow |
 |
|---|
| Try MShigh |
 |
|---|
| ChTry MShigh |
 |
|---|
| ArgC MShigh |
 |
|---|
| LysN MShigh |
 |
|---|
| TryLysC MShigh |
 |
|---|
General Statistics
Number of major isoforms |
Number of additional isoforms |
Number of all proteins |
Number of amino acids |
Min. Seq. Length |
Max. Seq. Length |
Avg. Seq. Length |
Avg. Mol. Weight |
|---|---|---|---|---|---|---|---|
0 |
724282 |
29 |
1758 |
375.3 |
41.66 |
Amino acid frequency
Ala |
Cys |
Asp |
Glu |
Phe |
Gly |
His |
Ile |
Lys |
Leu |
|---|---|---|---|---|---|---|---|---|---|
9.53 ± 0.061 | 1.279 ± 0.019 |
6.062 ± 0.036 | 6.11 ± 0.046 |
4.494 ± 0.034 | 7.923 ± 0.052 |
1.823 ± 0.021 | 5.518 ± 0.049 |
4.835 ± 0.052 | 9.415 ± 0.056 |
Met |
Asn |
Gln |
Pro |
Arg |
Ser |
Thr |
Val |
Trp |
Tyr |
|---|---|---|---|---|---|---|---|---|---|
2.41 ± 0.024 | 3.628 ± 0.043 |
4.403 ± 0.035 | 3.156 ± 0.025 |
5.899 ± 0.048 | 5.777 ± 0.037 |
5.237 ± 0.035 | 7.199 ± 0.039 |
1.41 ± 0.022 | 3.89 ± 0.033 |
Most of the basic statistics you can see at this page can be downloaded from this CSV file
Proteome-pI is available under Creative Commons Attribution-NoDerivs license, for more details see here
| Reference: Kozlowski LP. Proteome-pI 2.0: Proteome Isoelectric Point Database Update. Nucleic Acids Res. 2021, doi: 10.1093/nar/gkab944 | Contact: Lukasz P. Kozlowski |
