Mycobacterium phage Ochi17
Taxonomy: Viruses; Duplodnaviria; Heunggongvirae; Uroviricota; Caudoviricetes; Caudovirales; Siphoviridae; Cheoctovirus; unclassified Cheoctovirus
Average proteome isoelectric point is 6.11
Get precalculated fractions of proteins
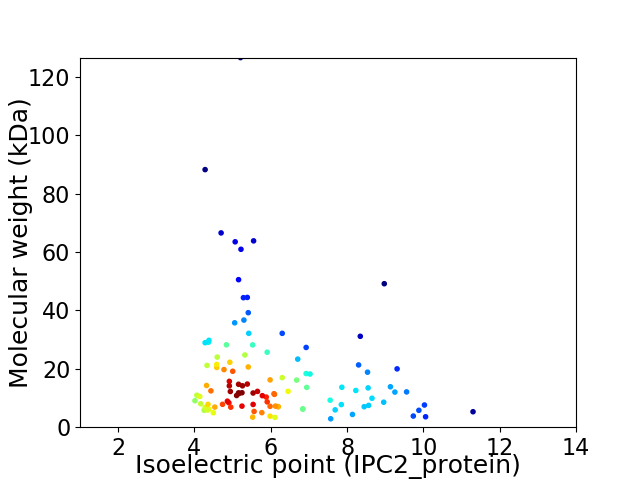
Virtual 2D-PAGE plot for 110 proteins (isoelectric point calculated using IPC2_protein)
Get csv file with sequences according to given criteria:
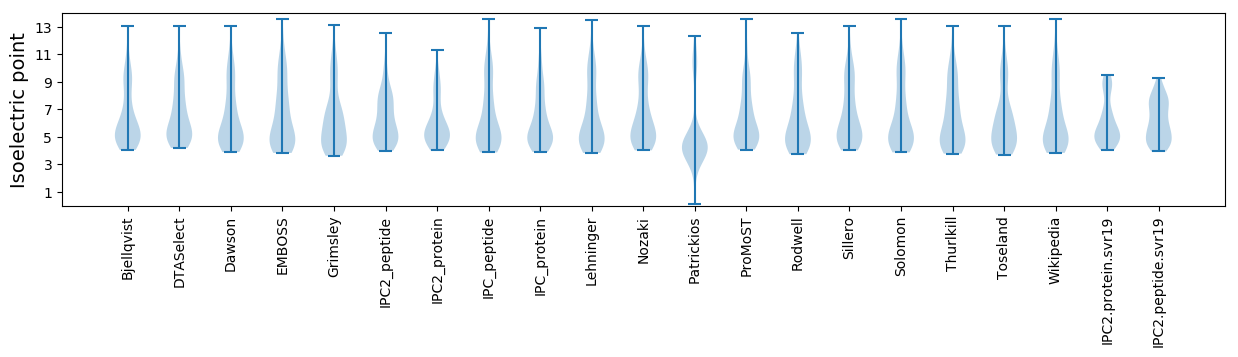
* You can choose from 21 different methods for calculating isoelectric point
Summary statistics related to proteome-wise predictions
Protein with the lowest isoelectric point:
>tr|A0A411BTK5|A0A411BTK5_9CAUD Uncharacterized protein OS=Mycobacterium phage Ochi17 OX=2502425 GN=86 PE=4 SV=1
MM1 pKa = 7.44TCLLCDD7 pKa = 4.01HH8 pKa = 7.18PRR10 pKa = 11.84STHH13 pKa = 5.0TPQCRR18 pKa = 11.84VRR20 pKa = 11.84LGVDD24 pKa = 2.92ADD26 pKa = 3.62DD27 pKa = 3.59MTRR30 pKa = 11.84YY31 pKa = 6.71TQCLCPGFEE40 pKa = 4.22GTEE43 pKa = 4.11EE44 pKa = 5.26EE45 pKa = 4.28EE46 pKa = 4.68DD47 pKa = 3.38TWLDD51 pKa = 3.26
MM1 pKa = 7.44TCLLCDD7 pKa = 4.01HH8 pKa = 7.18PRR10 pKa = 11.84STHH13 pKa = 5.0TPQCRR18 pKa = 11.84VRR20 pKa = 11.84LGVDD24 pKa = 2.92ADD26 pKa = 3.62DD27 pKa = 3.59MTRR30 pKa = 11.84YY31 pKa = 6.71TQCLCPGFEE40 pKa = 4.22GTEE43 pKa = 4.11EE44 pKa = 5.26EE45 pKa = 4.28EE46 pKa = 4.68DD47 pKa = 3.38TWLDD51 pKa = 3.26
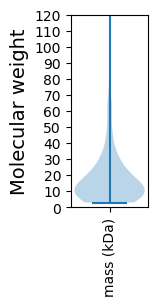
Molecular weight: 5.88 kDa
Isoelectric point according different methods:
Protein with the highest isoelectric point:
>tr|A0A411BTN2|A0A411BTN2_9CAUD HNH endonuclease OS=Mycobacterium phage Ochi17 OX=2502425 GN=110 PE=4 SV=1
MM1 pKa = 7.63RR2 pKa = 11.84RR3 pKa = 11.84MLPHH7 pKa = 6.88PRR9 pKa = 11.84PARR12 pKa = 11.84HH13 pKa = 5.82RR14 pKa = 11.84RR15 pKa = 11.84IHH17 pKa = 4.46HH18 pKa = 5.43HH19 pKa = 5.71RR20 pKa = 11.84RR21 pKa = 11.84RR22 pKa = 11.84PTLHH26 pKa = 7.02PPTPRR31 pKa = 11.84PRR33 pKa = 11.84RR34 pKa = 11.84PPSTHH39 pKa = 6.9RR40 pKa = 11.84GTPP43 pKa = 3.19
MM1 pKa = 7.63RR2 pKa = 11.84RR3 pKa = 11.84MLPHH7 pKa = 6.88PRR9 pKa = 11.84PARR12 pKa = 11.84HH13 pKa = 5.82RR14 pKa = 11.84RR15 pKa = 11.84IHH17 pKa = 4.46HH18 pKa = 5.43HH19 pKa = 5.71RR20 pKa = 11.84RR21 pKa = 11.84RR22 pKa = 11.84PTLHH26 pKa = 7.02PPTPRR31 pKa = 11.84PRR33 pKa = 11.84RR34 pKa = 11.84PPSTHH39 pKa = 6.9RR40 pKa = 11.84GTPP43 pKa = 3.19
Molecular weight: 5.3 kDa
Isoelectric point according different methods:
Peptides (in silico digests for buttom-up proteomics)
Below you can find in silico digests of the whole proteome with Trypsin, Chymotrypsin, Trypsin+LysC, LysN, ArgC proteases suitable for different mass spec machines.| Try ESI |
 |
|---|
| ChTry ESI |
|
|---|
| ArgC ESI |
|
|---|
| LysN ESI |
|
|---|
| TryLysC ESI |
|
|---|
| Try MALDI |
|
|---|
| ChTry MALDI |
|
|---|
| ArgC MALDI |
|
|---|
| LysN MALDI |
|
|---|
| TryLysC MALDI |
|
|---|
| Try LTQ |
|
|---|
| ChTry LTQ |
|
|---|
| ArgC LTQ |
|
|---|
| LysN LTQ |
|
|---|
| TryLysC LTQ |
|
|---|
| Try MSlow |
|
|---|
| ChTry MSlow |
|
|---|
| ArgC MSlow |
|
|---|
| LysN MSlow |
|
|---|
| TryLysC MSlow |
|
|---|
| Try MShigh |
|
|---|
| ChTry MShigh |
|
|---|
| ArgC MShigh |
|
|---|
| LysN MShigh |
|
|---|
| TryLysC MShigh |
|
|---|
General Statistics
Number of major isoforms |
Number of additional isoforms |
Number of all proteins |
Number of amino acids |
Min. Seq. Length |
Max. Seq. Length |
Avg. Seq. Length |
Avg. Mol. Weight |
|---|---|---|---|---|---|---|---|
0 |
18686 |
25 |
1252 |
169.9 |
18.59 |
Amino acid frequency
Ala |
Cys |
Asp |
Glu |
Phe |
Gly |
His |
Ile |
Lys |
Leu |
|---|---|---|---|---|---|---|---|---|---|
10.773 ± 0.485 | 1.135 ± 0.149 |
6.486 ± 0.215 | 6.042 ± 0.291 |
3.029 ± 0.195 | 8.621 ± 0.486 |
2.221 ± 0.182 | 4.297 ± 0.184 |
3.388 ± 0.204 | 7.289 ± 0.215 |
Met |
Asn |
Gln |
Pro |
Arg |
Ser |
Thr |
Val |
Trp |
Tyr |
|---|---|---|---|---|---|---|---|---|---|
2.21 ± 0.119 | 3.2 ± 0.149 |
6.004 ± 0.208 | 3.537 ± 0.204 |
6.989 ± 0.397 | 6.24 ± 0.248 |
6.588 ± 0.266 | 7.144 ± 0.237 |
2.339 ± 0.16 | 2.467 ± 0.179 |
Most of the basic statistics you can see at this page can be downloaded from this CSV file
See this proteome in:

Proteome-pI is available under Creative Commons Attribution-NoDerivs license, for more details see here
| Reference: Kozlowski LP. Proteome-pI 2.0: Proteome Isoelectric Point Database Update. Nucleic Acids Res. 2021, doi: 10.1093/nar/gkab944 | Contact: Lukasz P. Kozlowski |