Fundicoccus ignavus
Taxonomy: cellular organisms; Bacteria; Terrabacteria group; Firmicutes; Bacilli; Lactobacillales; Aerococcaceae; Fundicoccus
Average proteome isoelectric point is 5.75
Get precalculated fractions of proteins

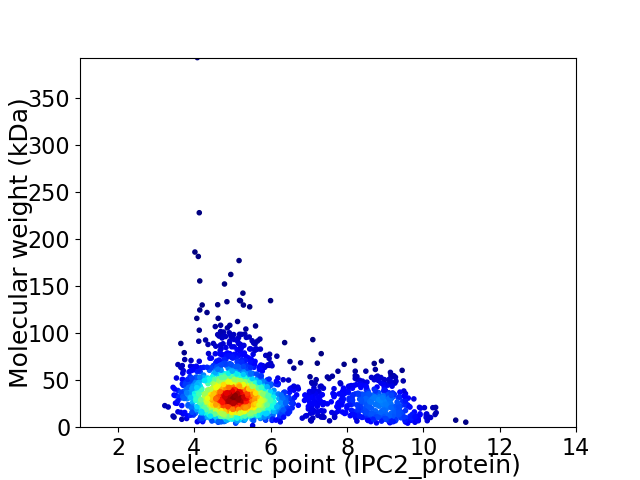
Virtual 2D-PAGE plot for 2258 proteins (isoelectric point calculated using IPC2_protein)
Get csv file with sequences according to given criteria:
* You can choose from 21 different methods for calculating isoelectric point
Summary statistics related to proteome-wise predictions


Protein with the lowest isoelectric point:
>tr|A0A6I2GPF8|A0A6I2GPF8_9LACT Uncharacterized protein OS=Fundicoccus ignavus OX=2664442 GN=GIY09_05520 PE=4 SV=1
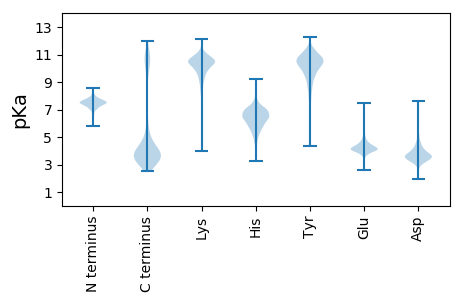
MM1 pKa = 7.82KK2 pKa = 10.24KK3 pKa = 10.26RR4 pKa = 11.84LILTGLTLLALGGILPSTHH23 pKa = 5.64SVYY26 pKa = 11.0AEE28 pKa = 3.87EE29 pKa = 4.55LVSDD33 pKa = 3.58VTLNVGILPAEE44 pKa = 3.99SAIPIIIAKK53 pKa = 9.37EE54 pKa = 3.74NGYY57 pKa = 10.44FEE59 pKa = 5.81ALGLDD64 pKa = 3.75VDD66 pKa = 3.96IHH68 pKa = 5.84TFAAPTDD75 pKa = 3.81RR76 pKa = 11.84NIAIQAKK83 pKa = 9.65EE84 pKa = 4.08LDD86 pKa = 3.49ATIADD91 pKa = 3.97VMTEE95 pKa = 3.83ATFKK99 pKa = 11.15QNGIDD104 pKa = 3.63MVITSDD110 pKa = 3.1ILEE113 pKa = 4.52DD114 pKa = 4.16FKK116 pKa = 11.92VLASPNSGVTEE127 pKa = 4.05MEE129 pKa = 3.83EE130 pKa = 4.86LADD133 pKa = 4.45KK134 pKa = 10.98DD135 pKa = 3.32ITLVPNFILEE145 pKa = 4.43YY146 pKa = 10.72IMDD149 pKa = 4.24VYY151 pKa = 10.61ATEE154 pKa = 5.2GNFTYY159 pKa = 10.72NIVEE163 pKa = 4.03ITSFSARR170 pKa = 11.84SEE172 pKa = 4.02ALLNDD177 pKa = 3.55QVDD180 pKa = 3.5AAVYY184 pKa = 8.47TEE186 pKa = 4.6PQASMLVAQGAINLGSSADD205 pKa = 3.58AGIKK209 pKa = 10.43GGTIQFMADD218 pKa = 3.04VVAEE222 pKa = 4.34RR223 pKa = 11.84PQDD226 pKa = 3.07ISAFYY231 pKa = 9.8QAYY234 pKa = 9.16NQAIDD239 pKa = 3.66YY240 pKa = 9.25MNEE243 pKa = 3.45NSAASYY249 pKa = 11.57AEE251 pKa = 3.75VLSNYY256 pKa = 7.31EE257 pKa = 3.91FPEE260 pKa = 4.25AMSTYY265 pKa = 10.49LDD267 pKa = 4.07SKK269 pKa = 10.4EE270 pKa = 3.85VAYY273 pKa = 9.05PYY275 pKa = 10.72AQAVPQDD282 pKa = 3.41QFDD285 pKa = 4.98NIIEE289 pKa = 4.22WTVSKK294 pKa = 10.8GQIDD298 pKa = 3.46TAYY301 pKa = 9.72TYY303 pKa = 11.25DD304 pKa = 3.65EE305 pKa = 4.3LTNFTFLTEE314 pKa = 3.94
MM1 pKa = 7.82KK2 pKa = 10.24KK3 pKa = 10.26RR4 pKa = 11.84LILTGLTLLALGGILPSTHH23 pKa = 5.64SVYY26 pKa = 11.0AEE28 pKa = 3.87EE29 pKa = 4.55LVSDD33 pKa = 3.58VTLNVGILPAEE44 pKa = 3.99SAIPIIIAKK53 pKa = 9.37EE54 pKa = 3.74NGYY57 pKa = 10.44FEE59 pKa = 5.81ALGLDD64 pKa = 3.75VDD66 pKa = 3.96IHH68 pKa = 5.84TFAAPTDD75 pKa = 3.81RR76 pKa = 11.84NIAIQAKK83 pKa = 9.65EE84 pKa = 4.08LDD86 pKa = 3.49ATIADD91 pKa = 3.97VMTEE95 pKa = 3.83ATFKK99 pKa = 11.15QNGIDD104 pKa = 3.63MVITSDD110 pKa = 3.1ILEE113 pKa = 4.52DD114 pKa = 4.16FKK116 pKa = 11.92VLASPNSGVTEE127 pKa = 4.05MEE129 pKa = 3.83EE130 pKa = 4.86LADD133 pKa = 4.45KK134 pKa = 10.98DD135 pKa = 3.32ITLVPNFILEE145 pKa = 4.43YY146 pKa = 10.72IMDD149 pKa = 4.24VYY151 pKa = 10.61ATEE154 pKa = 5.2GNFTYY159 pKa = 10.72NIVEE163 pKa = 4.03ITSFSARR170 pKa = 11.84SEE172 pKa = 4.02ALLNDD177 pKa = 3.55QVDD180 pKa = 3.5AAVYY184 pKa = 8.47TEE186 pKa = 4.6PQASMLVAQGAINLGSSADD205 pKa = 3.58AGIKK209 pKa = 10.43GGTIQFMADD218 pKa = 3.04VVAEE222 pKa = 4.34RR223 pKa = 11.84PQDD226 pKa = 3.07ISAFYY231 pKa = 9.8QAYY234 pKa = 9.16NQAIDD239 pKa = 3.66YY240 pKa = 9.25MNEE243 pKa = 3.45NSAASYY249 pKa = 11.57AEE251 pKa = 3.75VLSNYY256 pKa = 7.31EE257 pKa = 3.91FPEE260 pKa = 4.25AMSTYY265 pKa = 10.49LDD267 pKa = 4.07SKK269 pKa = 10.4EE270 pKa = 3.85VAYY273 pKa = 9.05PYY275 pKa = 10.72AQAVPQDD282 pKa = 3.41QFDD285 pKa = 4.98NIIEE289 pKa = 4.22WTVSKK294 pKa = 10.8GQIDD298 pKa = 3.46TAYY301 pKa = 9.72TYY303 pKa = 11.25DD304 pKa = 3.65EE305 pKa = 4.3LTNFTFLTEE314 pKa = 3.94
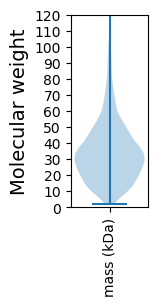
Molecular weight: 34.33 kDa
Isoelectric point according different methods:
Protein with the highest isoelectric point:
>tr|A0A6I2GNS9|A0A6I2GNS9_9LACT CBS domain-containing protein OS=Fundicoccus ignavus OX=2664442 GN=GIY09_09810 PE=4 SV=1
MM1 pKa = 7.36KK2 pKa = 9.43RR3 pKa = 11.84TYY5 pKa = 9.67QPKK8 pKa = 9.36KK9 pKa = 7.48RR10 pKa = 11.84TRR12 pKa = 11.84KK13 pKa = 9.06KK14 pKa = 8.41VHH16 pKa = 5.85GFRR19 pKa = 11.84KK20 pKa = 10.01RR21 pKa = 11.84MSTKK25 pKa = 10.02NGRR28 pKa = 11.84NVLARR33 pKa = 11.84RR34 pKa = 11.84RR35 pKa = 11.84LKK37 pKa = 10.59GRR39 pKa = 11.84KK40 pKa = 8.94KK41 pKa = 9.83IAAA44 pKa = 3.97
MM1 pKa = 7.36KK2 pKa = 9.43RR3 pKa = 11.84TYY5 pKa = 9.67QPKK8 pKa = 9.36KK9 pKa = 7.48RR10 pKa = 11.84TRR12 pKa = 11.84KK13 pKa = 9.06KK14 pKa = 8.41VHH16 pKa = 5.85GFRR19 pKa = 11.84KK20 pKa = 10.01RR21 pKa = 11.84MSTKK25 pKa = 10.02NGRR28 pKa = 11.84NVLARR33 pKa = 11.84RR34 pKa = 11.84RR35 pKa = 11.84LKK37 pKa = 10.59GRR39 pKa = 11.84KK40 pKa = 8.94KK41 pKa = 9.83IAAA44 pKa = 3.97
Molecular weight: 5.34 kDa
Isoelectric point according different methods:
Peptides (in silico digests for buttom-up proteomics)
Below you can find in silico digests of the whole proteome with Trypsin, Chymotrypsin, Trypsin+LysC, LysN, ArgC proteases suitable for different mass spec machines.| Try ESI |
 |
|---|
| ChTry ESI |
 |
|---|
| ArgC ESI |
 |
|---|
| LysN ESI |
 |
|---|
| TryLysC ESI |
 |
|---|
| Try MALDI |
 |
|---|
| ChTry MALDI |
 |
|---|
| ArgC MALDI |
 |
|---|
| LysN MALDI |
 |
|---|
| TryLysC MALDI |
 |
|---|
| Try LTQ |
 |
|---|
| ChTry LTQ |
 |
|---|
| ArgC LTQ |
 |
|---|
| LysN LTQ |
 |
|---|
| TryLysC LTQ |
 |
|---|
| Try MSlow |
 |
|---|
| ChTry MSlow |
 |
|---|
| ArgC MSlow |
 |
|---|
| LysN MSlow |
 |
|---|
| TryLysC MSlow |
 |
|---|
| Try MShigh |
 |
|---|
| ChTry MShigh |
 |
|---|
| ArgC MShigh |
 |
|---|
| LysN MShigh |
 |
|---|
| TryLysC MShigh |
 |
|---|
General Statistics
Number of major isoforms |
Number of additional isoforms |
Number of all proteins |
Number of amino acids |
Min. Seq. Length |
Max. Seq. Length |
Avg. Seq. Length |
Avg. Mol. Weight |
|---|---|---|---|---|---|---|---|
0 |
718277 |
14 |
3562 |
318.1 |
35.64 |
Amino acid frequency
Ala |
Cys |
Asp |
Glu |
Phe |
Gly |
His |
Ile |
Lys |
Leu |
|---|---|---|---|---|---|---|---|---|---|
7.709 ± 0.053 | 0.484 ± 0.012 |
5.576 ± 0.039 | 7.601 ± 0.06 |
4.39 ± 0.041 | 6.386 ± 0.047 |
1.976 ± 0.026 | 7.661 ± 0.051 |
5.416 ± 0.044 | 9.986 ± 0.061 |
Met |
Asn |
Gln |
Pro |
Arg |
Ser |
Thr |
Val |
Trp |
Tyr |
|---|---|---|---|---|---|---|---|---|---|
2.618 ± 0.023 | 4.793 ± 0.038 |
3.404 ± 0.028 | 4.297 ± 0.042 |
3.948 ± 0.038 | 6.119 ± 0.04 |
5.8 ± 0.045 | 7.13 ± 0.044 |
0.913 ± 0.017 | 3.794 ± 0.034 |
Most of the basic statistics you can see at this page can be downloaded from this CSV file
Proteome-pI is available under Creative Commons Attribution-NoDerivs license, for more details see here
| Reference: Kozlowski LP. Proteome-pI 2.0: Proteome Isoelectric Point Database Update. Nucleic Acids Res. 2021, doi: 10.1093/nar/gkab944 | Contact: Lukasz P. Kozlowski |
