Methanococcoides burtonii (strain DSM 6242 / NBRC 107633 / OCM 468 / ACE-M)
Taxonomy: cellular organisms; Archaea; Euryarchaeota; Stenosarchaea group; Methanomicrobia; Methanosarcinales; Methanosarcinaceae; Methanococcoides; Methanococcoides burtonii
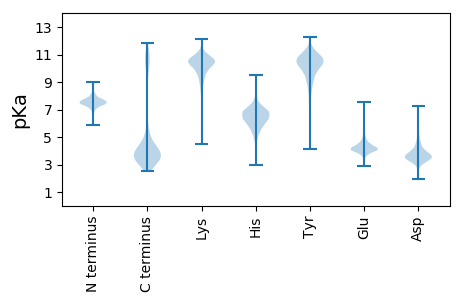
Average proteome isoelectric point is 5.74
Get precalculated fractions of proteins

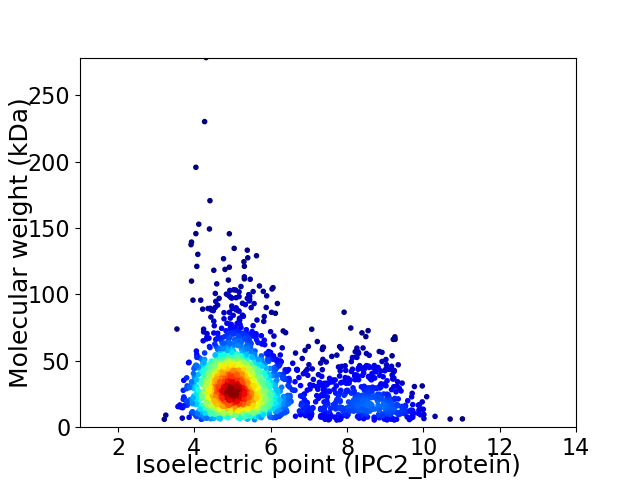
Virtual 2D-PAGE plot for 2242 proteins (isoelectric point calculated using IPC2_protein)
Get csv file with sequences according to given criteria:
* You can choose from 21 different methods for calculating isoelectric point
Summary statistics related to proteome-wise predictions


Protein with the lowest isoelectric point:
>tr|Q12U04|Q12U04_METBU RNA-splicing ligase RtcB OS=Methanococcoides burtonii (strain DSM 6242 / NBRC 107633 / OCM 468 / ACE-M) OX=259564 GN=rtcB PE=3 SV=1
MM1 pKa = 7.05QSKK4 pKa = 10.37SRR6 pKa = 11.84TKK8 pKa = 7.68MHH10 pKa = 6.62RR11 pKa = 11.84RR12 pKa = 11.84YY13 pKa = 10.38ASIGITIAVVIMMVLSGPVSAVTVGITGLDD43 pKa = 3.24GTTPTKK49 pKa = 10.63GDD51 pKa = 3.41SVTFDD56 pKa = 3.14VTATIEE62 pKa = 4.79DD63 pKa = 3.89PDD65 pKa = 4.33KK66 pKa = 11.18YY67 pKa = 11.45VPIDD71 pKa = 3.85NFSLDD76 pKa = 3.18ITGATTTEE84 pKa = 4.52VVFSTDD90 pKa = 2.98GTVLSGSGITVVAVTSPLSAEE111 pKa = 4.04YY112 pKa = 10.61GHH114 pKa = 6.97GYY116 pKa = 10.15GYY118 pKa = 10.94GYY120 pKa = 10.45DD121 pKa = 3.65SNVGYY126 pKa = 10.42GYY128 pKa = 10.86DD129 pKa = 3.11FGYY132 pKa = 10.89GYY134 pKa = 11.07GYY136 pKa = 10.83GYY138 pKa = 11.0GYY140 pKa = 10.57GAGGEE145 pKa = 4.14DD146 pKa = 3.48VEE148 pKa = 4.56YY149 pKa = 10.48KK150 pKa = 9.46YY151 pKa = 9.43TITLDD156 pKa = 3.44TSILNTGAHH165 pKa = 5.61EE166 pKa = 4.65AVLSLNTGNSAKK178 pKa = 10.24PSFDD182 pKa = 3.56SPSASFTIEE191 pKa = 3.87AASSPSSGGSSGGGSGSGGVRR212 pKa = 11.84IVAADD217 pKa = 3.59DD218 pKa = 3.76TEE220 pKa = 4.28EE221 pKa = 5.07PEE223 pKa = 5.2DD224 pKa = 3.94DD225 pKa = 3.94TGSGDD230 pKa = 3.81GTDD233 pKa = 3.73GTTDD237 pKa = 3.51SDD239 pKa = 4.36DD240 pKa = 4.06GTDD243 pKa = 3.48GTTDD247 pKa = 3.3SDD249 pKa = 4.02DD250 pKa = 3.86GTNEE254 pKa = 4.01TTPEE258 pKa = 4.13TTEE261 pKa = 4.29KK262 pKa = 10.7PSGLLPGFEE271 pKa = 4.48AVFAIAGLLAVAYY284 pKa = 9.34IVRR287 pKa = 11.84RR288 pKa = 11.84KK289 pKa = 10.42DD290 pKa = 3.0IEE292 pKa = 3.86
MM1 pKa = 7.05QSKK4 pKa = 10.37SRR6 pKa = 11.84TKK8 pKa = 7.68MHH10 pKa = 6.62RR11 pKa = 11.84RR12 pKa = 11.84YY13 pKa = 10.38ASIGITIAVVIMMVLSGPVSAVTVGITGLDD43 pKa = 3.24GTTPTKK49 pKa = 10.63GDD51 pKa = 3.41SVTFDD56 pKa = 3.14VTATIEE62 pKa = 4.79DD63 pKa = 3.89PDD65 pKa = 4.33KK66 pKa = 11.18YY67 pKa = 11.45VPIDD71 pKa = 3.85NFSLDD76 pKa = 3.18ITGATTTEE84 pKa = 4.52VVFSTDD90 pKa = 2.98GTVLSGSGITVVAVTSPLSAEE111 pKa = 4.04YY112 pKa = 10.61GHH114 pKa = 6.97GYY116 pKa = 10.15GYY118 pKa = 10.94GYY120 pKa = 10.45DD121 pKa = 3.65SNVGYY126 pKa = 10.42GYY128 pKa = 10.86DD129 pKa = 3.11FGYY132 pKa = 10.89GYY134 pKa = 11.07GYY136 pKa = 10.83GYY138 pKa = 11.0GYY140 pKa = 10.57GAGGEE145 pKa = 4.14DD146 pKa = 3.48VEE148 pKa = 4.56YY149 pKa = 10.48KK150 pKa = 9.46YY151 pKa = 9.43TITLDD156 pKa = 3.44TSILNTGAHH165 pKa = 5.61EE166 pKa = 4.65AVLSLNTGNSAKK178 pKa = 10.24PSFDD182 pKa = 3.56SPSASFTIEE191 pKa = 3.87AASSPSSGGSSGGGSGSGGVRR212 pKa = 11.84IVAADD217 pKa = 3.59DD218 pKa = 3.76TEE220 pKa = 4.28EE221 pKa = 5.07PEE223 pKa = 5.2DD224 pKa = 3.94DD225 pKa = 3.94TGSGDD230 pKa = 3.81GTDD233 pKa = 3.73GTTDD237 pKa = 3.51SDD239 pKa = 4.36DD240 pKa = 4.06GTDD243 pKa = 3.48GTTDD247 pKa = 3.3SDD249 pKa = 4.02DD250 pKa = 3.86GTNEE254 pKa = 4.01TTPEE258 pKa = 4.13TTEE261 pKa = 4.29KK262 pKa = 10.7PSGLLPGFEE271 pKa = 4.48AVFAIAGLLAVAYY284 pKa = 9.34IVRR287 pKa = 11.84RR288 pKa = 11.84KK289 pKa = 10.42DD290 pKa = 3.0IEE292 pKa = 3.86
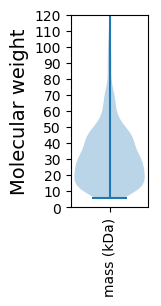
Molecular weight: 29.82 kDa
Isoelectric point according different methods:
Protein with the highest isoelectric point:
>tr|Q12U96|Q12U96_METBU AAA ATPase OS=Methanococcoides burtonii (strain DSM 6242 / NBRC 107633 / OCM 468 / ACE-M) OX=259564 GN=Mbur_2106 PE=3 SV=1
MM1 pKa = 7.6GKK3 pKa = 7.95TGSINWVKK11 pKa = 10.73VKK13 pKa = 10.17GRR15 pKa = 11.84KK16 pKa = 9.1GKK18 pKa = 9.95IIKK21 pKa = 8.14VQRR24 pKa = 11.84AFGAKK29 pKa = 9.27AHH31 pKa = 6.82PGPAQRR37 pKa = 11.84FSSSGAKK44 pKa = 9.49RR45 pKa = 11.84RR46 pKa = 11.84FLKK49 pKa = 10.45RR50 pKa = 11.84SPKK53 pKa = 10.59SIVNN57 pKa = 3.59
MM1 pKa = 7.6GKK3 pKa = 7.95TGSINWVKK11 pKa = 10.73VKK13 pKa = 10.17GRR15 pKa = 11.84KK16 pKa = 9.1GKK18 pKa = 9.95IIKK21 pKa = 8.14VQRR24 pKa = 11.84AFGAKK29 pKa = 9.27AHH31 pKa = 6.82PGPAQRR37 pKa = 11.84FSSSGAKK44 pKa = 9.49RR45 pKa = 11.84RR46 pKa = 11.84FLKK49 pKa = 10.45RR50 pKa = 11.84SPKK53 pKa = 10.59SIVNN57 pKa = 3.59
Molecular weight: 6.25 kDa
Isoelectric point according different methods:
Peptides (in silico digests for buttom-up proteomics)
Below you can find in silico digests of the whole proteome with Trypsin, Chymotrypsin, Trypsin+LysC, LysN, ArgC proteases suitable for different mass spec machines.| Try ESI |
 |
|---|
| ChTry ESI |
 |
|---|
| ArgC ESI |
 |
|---|
| LysN ESI |
 |
|---|
| TryLysC ESI |
 |
|---|
| Try MALDI |
 |
|---|
| ChTry MALDI |
 |
|---|
| ArgC MALDI |
 |
|---|
| LysN MALDI |
 |
|---|
| TryLysC MALDI |
 |
|---|
| Try LTQ |
 |
|---|
| ChTry LTQ |
 |
|---|
| ArgC LTQ |
 |
|---|
| LysN LTQ |
 |
|---|
| TryLysC LTQ |
 |
|---|
| Try MSlow |
 |
|---|
| ChTry MSlow |
 |
|---|
| ArgC MSlow |
 |
|---|
| LysN MSlow |
 |
|---|
| TryLysC MSlow |
 |
|---|
| Try MShigh |
 |
|---|
| ChTry MShigh |
 |
|---|
| ArgC MShigh |
 |
|---|
| LysN MShigh |
 |
|---|
| TryLysC MShigh |
 |
|---|
General Statistics
Number of major isoforms |
Number of additional isoforms |
Number of all proteins |
Number of amino acids |
Min. Seq. Length |
Max. Seq. Length |
Avg. Seq. Length |
Avg. Mol. Weight |
|---|---|---|---|---|---|---|---|
0 |
676646 |
45 |
2552 |
301.8 |
33.61 |
Amino acid frequency
Ala |
Cys |
Asp |
Glu |
Phe |
Gly |
His |
Ile |
Lys |
Leu |
|---|---|---|---|---|---|---|---|---|---|
6.797 ± 0.048 | 1.199 ± 0.022 |
6.339 ± 0.04 | 7.318 ± 0.048 |
4.013 ± 0.038 | 7.088 ± 0.048 |
1.935 ± 0.023 | 8.455 ± 0.057 |
6.406 ± 0.051 | 8.948 ± 0.055 |
Met |
Asn |
Gln |
Pro |
Arg |
Ser |
Thr |
Val |
Trp |
Tyr |
|---|---|---|---|---|---|---|---|---|---|
3.009 ± 0.028 | 4.593 ± 0.051 |
3.625 ± 0.027 | 2.432 ± 0.026 |
4.108 ± 0.04 | 6.749 ± 0.045 |
5.424 ± 0.043 | 7.318 ± 0.045 |
0.865 ± 0.018 | 3.379 ± 0.029 |
Most of the basic statistics you can see at this page can be downloaded from this CSV file
Proteome-pI is available under Creative Commons Attribution-NoDerivs license, for more details see here
| Reference: Kozlowski LP. Proteome-pI 2.0: Proteome Isoelectric Point Database Update. Nucleic Acids Res. 2021, doi: 10.1093/nar/gkab944 | Contact: Lukasz P. Kozlowski |
