Bacilli bacterium VT-13-104
Taxonomy: cellular organisms; Bacteria; Terrabacteria group; Firmicutes; Bacilli; unclassified Bacilli
Average proteome isoelectric point is 6.27
Get precalculated fractions of proteins

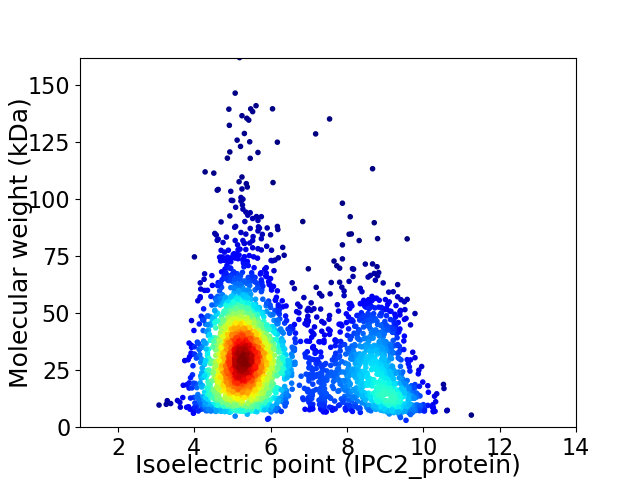
Virtual 2D-PAGE plot for 3231 proteins (isoelectric point calculated using IPC2_protein)
Get csv file with sequences according to given criteria:
* You can choose from 21 different methods for calculating isoelectric point
Summary statistics related to proteome-wise predictions


Protein with the lowest isoelectric point:
>tr|A0A0K0GBD2|A0A0K0GBD2_9FIRM 3-mercaptopyruvate sulfurtransferase OS=Bacilli bacterium VT-13-104 OX=1637974 GN=WH51_07045 PE=4 SV=1
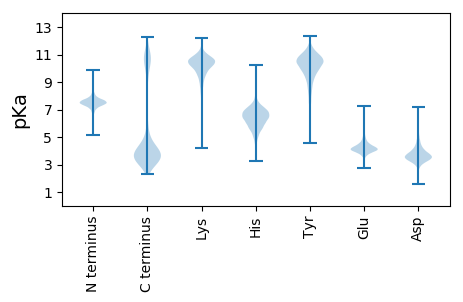
MM1 pKa = 7.19AQSNQTAGKK10 pKa = 8.76YY11 pKa = 8.85VLSIAFVSSLVFTPVLSGKK30 pKa = 9.71VFANAGADD38 pKa = 3.37ASEE41 pKa = 3.95GDD43 pKa = 3.51ITISEE48 pKa = 4.55SNLSNIQEE56 pKa = 4.12QEE58 pKa = 4.16VASSSEE64 pKa = 3.82GTLIQHH70 pKa = 6.81GDD72 pKa = 2.91VGAAVEE78 pKa = 5.08DD79 pKa = 3.84IQKK82 pKa = 10.07EE83 pKa = 4.18LQEE86 pKa = 4.1QGYY89 pKa = 7.36YY90 pKa = 10.11TYY92 pKa = 10.21TIDD95 pKa = 5.45GIFGSITGQAVRR107 pKa = 11.84DD108 pKa = 3.96YY109 pKa = 11.08QADD112 pKa = 3.01HH113 pKa = 6.83HH114 pKa = 6.69LQVDD118 pKa = 5.22GIVGPNTLEE127 pKa = 4.01TMALPEE133 pKa = 4.32MEE135 pKa = 4.35SSEE138 pKa = 4.52DD139 pKa = 3.37NLTITEE145 pKa = 4.22IDD147 pKa = 3.48SSEE150 pKa = 4.53DD151 pKa = 3.24NLTVTEE157 pKa = 4.5SSSEE161 pKa = 3.9DD162 pKa = 3.32VSNIKK167 pKa = 10.41SDD169 pKa = 3.03IVAVAKK175 pKa = 10.51SVIGTPYY182 pKa = 9.67VWGGTTTEE190 pKa = 4.67GMDD193 pKa = 3.1SSGFINYY200 pKa = 8.1VFNQVGIDD208 pKa = 3.98DD209 pKa = 3.84ISRR212 pKa = 11.84THH214 pKa = 7.72RR215 pKa = 11.84EE216 pKa = 3.24MWEE219 pKa = 3.67NDD221 pKa = 3.22GNYY224 pKa = 9.56VDD226 pKa = 4.98HH227 pKa = 7.4PSIGDD232 pKa = 3.39VVFFEE237 pKa = 4.46GTYY240 pKa = 8.58DD241 pKa = 3.53TEE243 pKa = 4.64GASHH247 pKa = 6.39SGVYY251 pKa = 9.75IGNNQMIHH259 pKa = 6.69AGDD262 pKa = 4.66DD263 pKa = 3.93GVSVADD269 pKa = 3.65ISIDD273 pKa = 3.39YY274 pKa = 7.82WQSHH278 pKa = 4.92YY279 pKa = 11.17LGAKK283 pKa = 9.83SFTEE287 pKa = 4.07
MM1 pKa = 7.19AQSNQTAGKK10 pKa = 8.76YY11 pKa = 8.85VLSIAFVSSLVFTPVLSGKK30 pKa = 9.71VFANAGADD38 pKa = 3.37ASEE41 pKa = 3.95GDD43 pKa = 3.51ITISEE48 pKa = 4.55SNLSNIQEE56 pKa = 4.12QEE58 pKa = 4.16VASSSEE64 pKa = 3.82GTLIQHH70 pKa = 6.81GDD72 pKa = 2.91VGAAVEE78 pKa = 5.08DD79 pKa = 3.84IQKK82 pKa = 10.07EE83 pKa = 4.18LQEE86 pKa = 4.1QGYY89 pKa = 7.36YY90 pKa = 10.11TYY92 pKa = 10.21TIDD95 pKa = 5.45GIFGSITGQAVRR107 pKa = 11.84DD108 pKa = 3.96YY109 pKa = 11.08QADD112 pKa = 3.01HH113 pKa = 6.83HH114 pKa = 6.69LQVDD118 pKa = 5.22GIVGPNTLEE127 pKa = 4.01TMALPEE133 pKa = 4.32MEE135 pKa = 4.35SSEE138 pKa = 4.52DD139 pKa = 3.37NLTITEE145 pKa = 4.22IDD147 pKa = 3.48SSEE150 pKa = 4.53DD151 pKa = 3.24NLTVTEE157 pKa = 4.5SSSEE161 pKa = 3.9DD162 pKa = 3.32VSNIKK167 pKa = 10.41SDD169 pKa = 3.03IVAVAKK175 pKa = 10.51SVIGTPYY182 pKa = 9.67VWGGTTTEE190 pKa = 4.67GMDD193 pKa = 3.1SSGFINYY200 pKa = 8.1VFNQVGIDD208 pKa = 3.98DD209 pKa = 3.84ISRR212 pKa = 11.84THH214 pKa = 7.72RR215 pKa = 11.84EE216 pKa = 3.24MWEE219 pKa = 3.67NDD221 pKa = 3.22GNYY224 pKa = 9.56VDD226 pKa = 4.98HH227 pKa = 7.4PSIGDD232 pKa = 3.39VVFFEE237 pKa = 4.46GTYY240 pKa = 8.58DD241 pKa = 3.53TEE243 pKa = 4.64GASHH247 pKa = 6.39SGVYY251 pKa = 9.75IGNNQMIHH259 pKa = 6.69AGDD262 pKa = 4.66DD263 pKa = 3.93GVSVADD269 pKa = 3.65ISIDD273 pKa = 3.39YY274 pKa = 7.82WQSHH278 pKa = 4.92YY279 pKa = 11.17LGAKK283 pKa = 9.83SFTEE287 pKa = 4.07
Molecular weight: 30.84 kDa
Isoelectric point according different methods:
Protein with the highest isoelectric point:
>tr|A0A0K0ILE5|A0A0K0ILE5_9FIRM Lipoate--protein ligase OS=Bacilli bacterium VT-13-104 OX=1637974 GN=WH51_16490 PE=4 SV=1
MM1 pKa = 7.44KK2 pKa = 9.6RR3 pKa = 11.84TFQPNNRR10 pKa = 11.84KK11 pKa = 9.23RR12 pKa = 11.84KK13 pKa = 8.22KK14 pKa = 8.69VHH16 pKa = 5.46GFRR19 pKa = 11.84ARR21 pKa = 11.84MSTKK25 pKa = 10.19NGRR28 pKa = 11.84KK29 pKa = 8.49VLARR33 pKa = 11.84RR34 pKa = 11.84RR35 pKa = 11.84RR36 pKa = 11.84KK37 pKa = 9.05GRR39 pKa = 11.84KK40 pKa = 8.7VLSAA44 pKa = 4.05
MM1 pKa = 7.44KK2 pKa = 9.6RR3 pKa = 11.84TFQPNNRR10 pKa = 11.84KK11 pKa = 9.23RR12 pKa = 11.84KK13 pKa = 8.22KK14 pKa = 8.69VHH16 pKa = 5.46GFRR19 pKa = 11.84ARR21 pKa = 11.84MSTKK25 pKa = 10.19NGRR28 pKa = 11.84KK29 pKa = 8.49VLARR33 pKa = 11.84RR34 pKa = 11.84RR35 pKa = 11.84RR36 pKa = 11.84KK37 pKa = 9.05GRR39 pKa = 11.84KK40 pKa = 8.7VLSAA44 pKa = 4.05
Molecular weight: 5.31 kDa
Isoelectric point according different methods:
Peptides (in silico digests for buttom-up proteomics)
Below you can find in silico digests of the whole proteome with Trypsin, Chymotrypsin, Trypsin+LysC, LysN, ArgC proteases suitable for different mass spec machines.| Try ESI |
 |
|---|
| ChTry ESI |
 |
|---|
| ArgC ESI |
 |
|---|
| LysN ESI |
 |
|---|
| TryLysC ESI |
 |
|---|
| Try MALDI |
 |
|---|
| ChTry MALDI |
 |
|---|
| ArgC MALDI |
 |
|---|
| LysN MALDI |
 |
|---|
| TryLysC MALDI |
 |
|---|
| Try LTQ |
 |
|---|
| ChTry LTQ |
 |
|---|
| ArgC LTQ |
 |
|---|
| LysN LTQ |
 |
|---|
| TryLysC LTQ |
 |
|---|
| Try MSlow |
 |
|---|
| ChTry MSlow |
 |
|---|
| ArgC MSlow |
 |
|---|
| LysN MSlow |
 |
|---|
| TryLysC MSlow |
 |
|---|
| Try MShigh |
 |
|---|
| ChTry MShigh |
 |
|---|
| ArgC MShigh |
 |
|---|
| LysN MShigh |
 |
|---|
| TryLysC MShigh |
 |
|---|
General Statistics
Number of major isoforms |
Number of additional isoforms |
Number of all proteins |
Number of amino acids |
Min. Seq. Length |
Max. Seq. Length |
Avg. Seq. Length |
Avg. Mol. Weight |
|---|---|---|---|---|---|---|---|
0 |
926547 |
26 |
1430 |
286.8 |
32.31 |
Amino acid frequency
Ala |
Cys |
Asp |
Glu |
Phe |
Gly |
His |
Ile |
Lys |
Leu |
|---|---|---|---|---|---|---|---|---|---|
6.409 ± 0.04 | 0.632 ± 0.013 |
5.246 ± 0.039 | 7.774 ± 0.061 |
4.559 ± 0.035 | 6.762 ± 0.04 |
2.034 ± 0.019 | 8.501 ± 0.05 |
7.272 ± 0.044 | 9.438 ± 0.045 |
Met |
Asn |
Gln |
Pro |
Arg |
Ser |
Thr |
Val |
Trp |
Tyr |
|---|---|---|---|---|---|---|---|---|---|
2.809 ± 0.021 | 4.888 ± 0.032 |
3.507 ± 0.022 | 3.544 ± 0.03 |
3.866 ± 0.03 | 5.918 ± 0.028 |
5.386 ± 0.026 | 6.91 ± 0.038 |
0.959 ± 0.016 | 3.583 ± 0.024 |
Most of the basic statistics you can see at this page can be downloaded from this CSV file
Proteome-pI is available under Creative Commons Attribution-NoDerivs license, for more details see here
| Reference: Kozlowski LP. Proteome-pI 2.0: Proteome Isoelectric Point Database Update. Nucleic Acids Res. 2021, doi: 10.1093/nar/gkab944 | Contact: Lukasz P. Kozlowski |
